 0
0
 28 May 2025, 10:07:38 am AEST
 6 min
6 min

 0
28 May 2025, 10:07:38 am AEST
6 min
0
28 May 2025, 10:07:38 am AEST
6 min

Looking for ways to monitor the health and status of your IBM Planning Analytics (PA) Application and Server? Here are some methods for automating monitoring and receiving alerts whenever issues arise in the backend of your PA applications. Before enabling these alerts, it's ...
Here are some methods for automating monitoring and receiving alerts whenever issues arise in the backend of your PA applications.
Before enabling these alerts, it's important to understand the key areas to monitor. Monitoring these aspects ensures your PA applications remain healthy, stable, and optimised for performance.
NOTE: Your Access role should be Administrator to view and perform all the below.
To assess the health of your PA applications and databases, follow these steps:
1. Log in to IBM Planning Analytics Workspace.
2. Navigate to Administration and click Databases.
3. Under Databases, select the desired PA application.
4. On the right-hand side of the page, click on Details to view the status and health metrics.
This provides a quick overview of the database’s performance and any potential issues that may require attention.
Sample Screenshot:
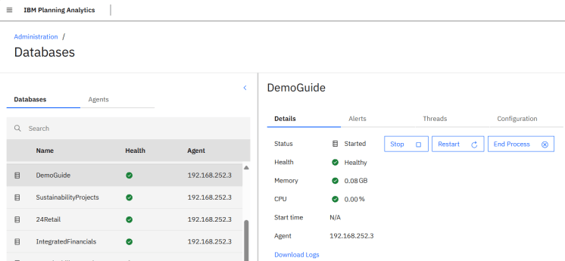
You will see various status icons that indicate the current health of the PA application. Here's what each icon represents:
 Indicates that the PA application is healthy and running without any issues.
 Indicates that the PA application is at risk of moving into a critical state. Proactive attention may be required.
 Indicates that the PA application is in a critical state and may potentially
lead to a system failure or downtime if not addressed immediately.
1. On the right-hand side of the application's detail page, click on Alerts.
2. From there, you can configure the threshold values that will trigger alerts based on system performance or issues.
3. To enable the Alerts, click on the respective  button, which changes to
  indicate it's enabled.
This allows proactive monitoring by notifying you when predefined conditions are met.
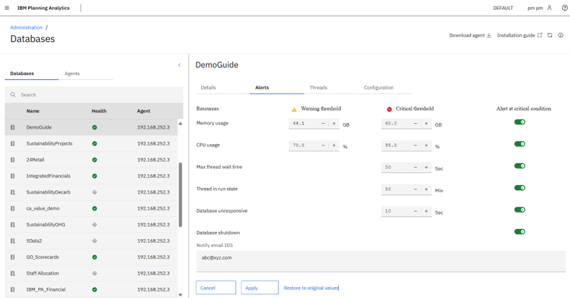
5. We can define the Warning threshold and Critical threshold values based on the size and memory utilised by the PA application under stable conditions.
6. Apart from that, we have options to define Critical Threshold values for factors such as –
Max thread wait time: we can set the Critical Threshold for maximum thread wait time for the respective PA Application to make sure the PA instance is not slowing down as we can kill thread as soon as possible.
Thread in run state: we can set the Critical Threshold to make sure the threads are not in Run state for more than expected in the respective PA Application, which has the possibility of slowing down the server.
Database unresponsive: we can set the Critical Threshold to note if Database/PA application is not responsive which helps us to action it as soon as possible.
6. We can enable the Database Shutdown Alert to enable notifications on the PA Application Stop/Downtime and Start/Restart activity.
7. We can add multiple email IDs to receive the notifications of the enabled Alerts, separated by a comma (‘, ’) in the Notify email IDs text box.
8. Click Apply to save the change made to the Alerts.
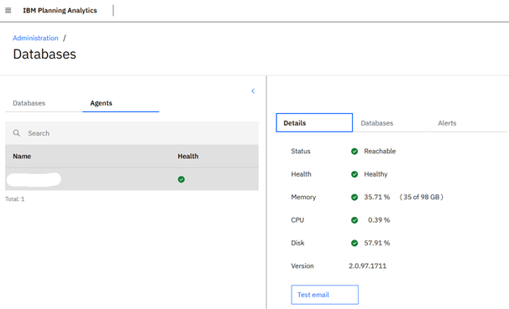
To assess the health of your PA Server/Agent, follow these steps;
1. Log in to IBM Planning Analytics Workspace.
2. Navigate to Administration and click Databases.
3. Under Agents, select the desired Agent.
4. On the right-hand side of the page, click on Details to view the status and health metrics.
This provides a quick overview of the database’s performance and any potential issues that may require attention.
1. On the right-hand side of the application's detail page, click on Alerts.
2. From there, you can configure the threshold values that will trigger alerts based on system performance or issues.
3. To enable the Alerts, click on the respective  button, which changes to
  indicates it's enabled.
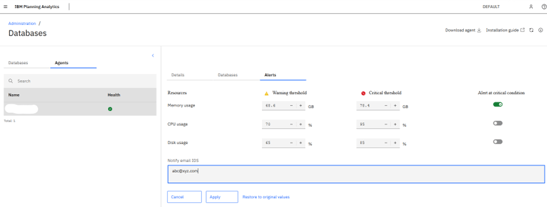
4. We can define the Warning threshold and Critical threshold values based on the size and memory utilized by the PA application on stable conditions.
5. We can add multiple emails IDs to receive the notifications of the enabled Alerts separated by a comma (‘ , ’) in the Notify email IDs text box.
6. Click Apply to save the change made to the Alerts.

Alpheus have a total of 7+ years of work experience in IBM Cognos TM1 and IBM Planning Analytics on Cloud.Consulting, Production Support and Development of TM1 models for multiple clients. Interacting with clients for implementing new requirement and resolving issues. Administration and Monitoring of daily data load. Developing Business solutions in different Planning Models for Clients as per their requirement.
 print
print


Leave a comment