Sandbox, also known as Personal Workspace is your personal work area where you can edit the data values as many times as you want and keep the changed data separate from the base data. Sandboxes and Personal Workspaces are private to each user and cannot be seen by other users. Your data values are viewable to others only when you commit them back to the base data. A Personal Workspace is a ...
Sandbox, also known as Personal Workspace is your personal work area where you can edit the data values as many times as you want and keep the changed data separate from the base data.
Sandboxes and Personal Workspaces are private to each user and cannot be seen by other users. Your data values are viewable to others only when you commit them back to the base data. A Personal Workspace is a special, default sandbox that is unnamed and always where you work if that capability is turned on.
To find out more about Sandbox, go the following link:

The first thing that must be done for using Sandbox comparison functionality is to enable the config parameter in tm1s.cfg file.
Set the config parameter, EnableSanboxDimension=T
This is a dynamic parameter so server restart is not required.
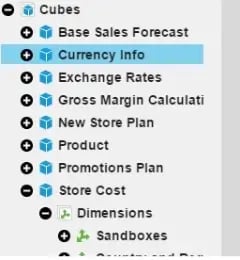
Once the parameter is set, expand the Dimensions within the cube and you will find a new virtual dimension called “Sandboxes”. This dimension stores all the sandboxes you’ve created in PAW.
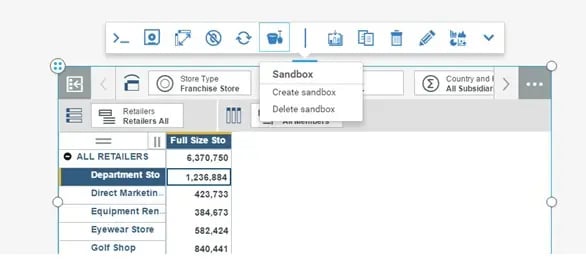
Select Create Sandbox
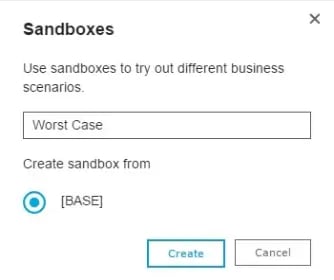
Provide name for sandbox and Click at icon next to BASE to use the values from Base data as a starting point
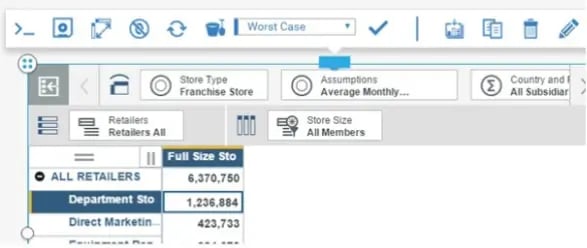
Below figure shows worst case sandbox created
Below figure shows the Worst Case data being overwritten from 6,370,750 to 6,000,000
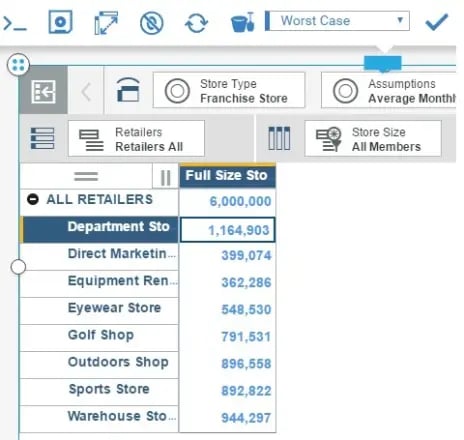
You may toggle between Base data and Sandbox data using the drop down menu. Select Base from the menu to see the base data

Below figure shows the amount 6,370,571 which hasn’t changed
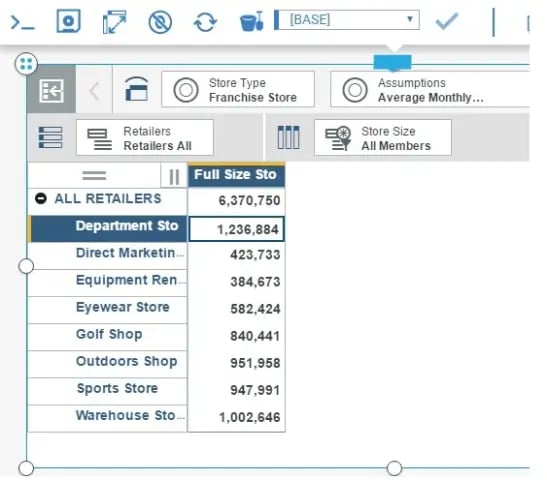
Drag and drop Sandboxes Virtual dimension to Column definition to compare the Sandbox data with Base data

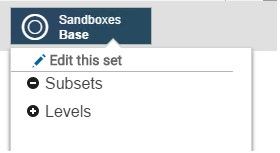
Click at Sandboxes dimension and select Edit this set from drop down
Bring the Worst Case Sandbox to right pane by clicking the Insert arrow
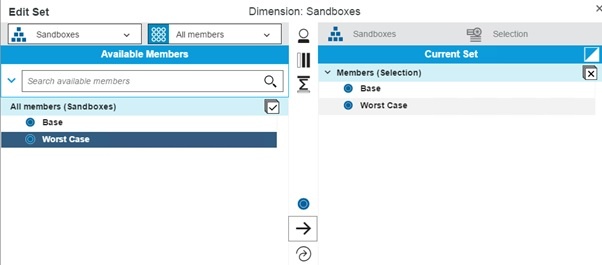
Click Apply and Close
The Sandbox and Base data can now be viewed side by side for comparison
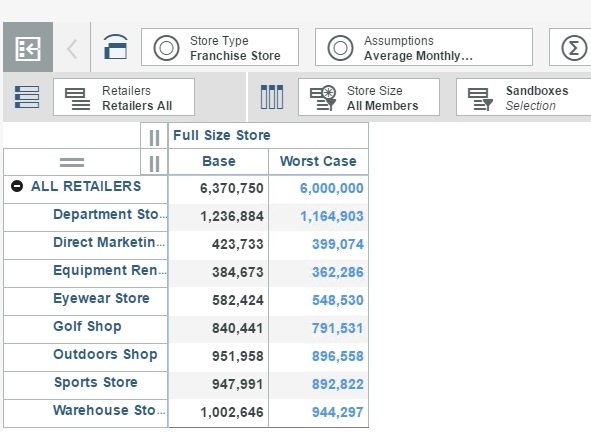
You may additionally create multiple sandboxes for perform various what-if analysis on your data in real-time. You can also create calculations on top of your base and sandbox data for variance analysis.
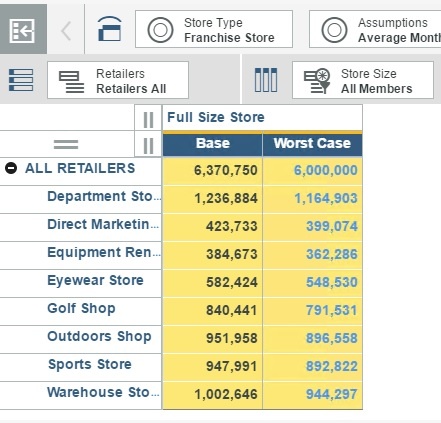
Control and click Base and Worst Case labels
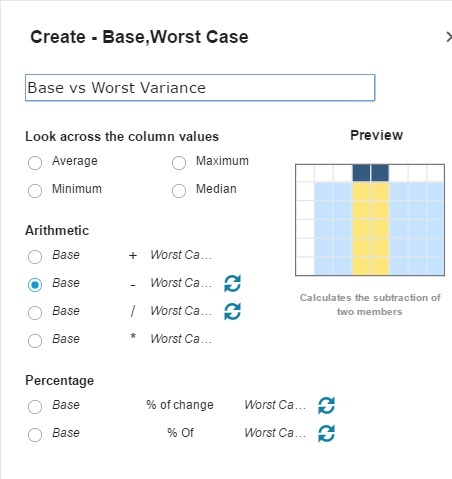
Select Base – Worst Case within Arithmetic calculations section and give a name to the calculation
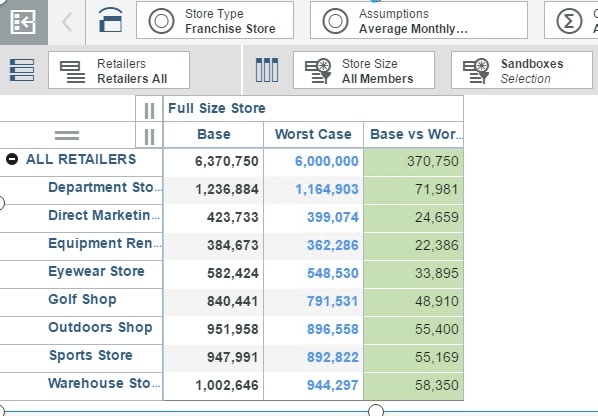
The resultant view shows the variance of Base and Worst Case Data.
Written by:
Amin Mohammed [Senior TM1 Consultant]
.jpg?width=211&name=logo%20(1).jpg)

we go the extra mile so you can go the distance|
Got a question? Shoot!
Lorem ipsum dolor sit amet, consectetur adipiscing elit, sed do eiusmod tempor incididunt ut labore et dolore magna aliqua.


.png?width=673&height=371&name=IBM_Gold-removebg-preview%20(1).png)
Leave a comment