The TurboIntegrator Debugger is a simple tool which allows users to set breakpoints and step through TurboIntegrator processes to identify possible issues or errors in your scripts. The TI Debugger is available for Planning Analytics Local.
Steps to configure TM1 Server can be found in the link below:
https://developer.ibm.com/recipes/tutorials/ibm-tm1-turbointegrator-debugger/
KEY FEATURES
- Process List
- User specified breakpoints
- View object locks on the TM1 server
- Save and edit TI scripts live

INTERFACE
The interface is very simple and user friendly with familiar tabs like Prolog, Metadata, Data and Epilog. The TI Debugger contains similar functionalities that of an IDE (Integrated Development Environment) to assist with ease of coding.
Below is the screenshot of the Interface
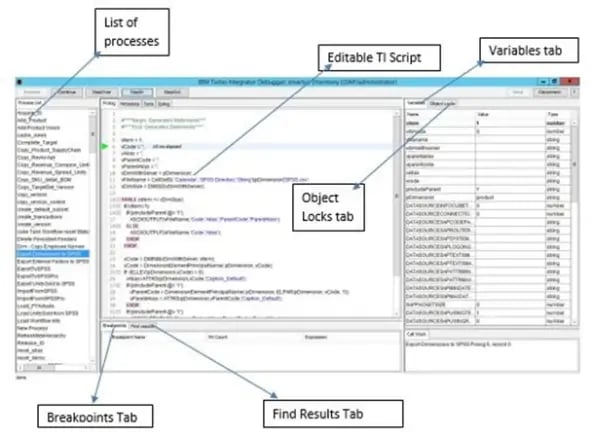
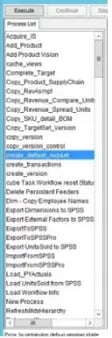
On the left side of the interface there is Process List, where you can find the list of all the editable processes available on the server. Refer to the screenshot below:
User can run the process by clicking on the Execute button on the top panel. 
As soon as the user executes the process, the following options will be enabled:
- Continue
- StepOver
- StepIn
- StepOut
When a user clicks on StepIn option, it goes to the next line and the resultant values of the variables either evaluated by a function or hardcoded, can be seen in the Variables tab on the right side, in real time.
Where there is IF condition, in case the condition returns True, StepIn goes within the formula block of If statement, otherwise it goes to Else or ElseIf or EndIf block depending on the structure of your If statement.
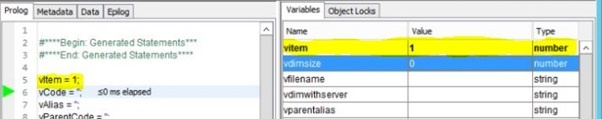
As you can see in the above screenshot, as soon as I clicked on the StepIn option, the 5th line has been already executed and the value of ‘vItem’ declared as 1 can be seen on the variables tab. Hence demonstrating that the debugging is in real time.
The same also works for any TI function as well.

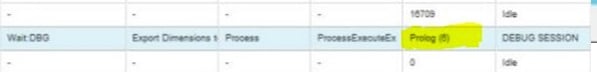
While TI debugging is on, TM1 keeps the process on wait and same can be seen in Operations Console page. It also shows the line which is being debugged in TI debugger. As per the screenshot below, Line no. 5 is being debugged, hence reflecting on Ops Console accordingly.
There is also a tab called Object Locks on the right-hand side (beside variables tab), in which we can see the locks obtained on the objects on the TM1 Server, while executing the TI process.
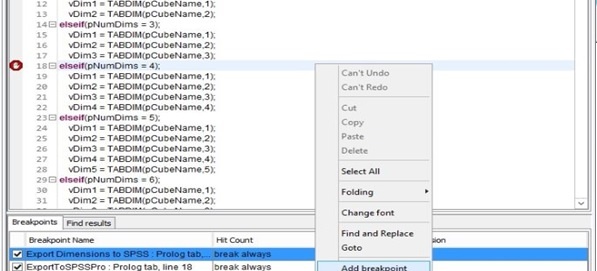
On the bottom panel you can find Breakpoints tab where you can Add, Edit and Delete the breakpoints. To add a new breakpoint, select the line where you want to add it, right click and click on “Add Breakpoint” or right click on breakpoint panel and click on “Add”. Similarly, you can right click and select delete breakpoint to delete the breakpoint.
All the breakpoints added are listed in the Breakpoints area. Breakpoint name is prefixed with the process name followed by tab in which it has been created and the line number.
A check against a breakpoint entails the Breakpoint is Active. To deactivate a breakpoint, simply uncheck the box next to it.
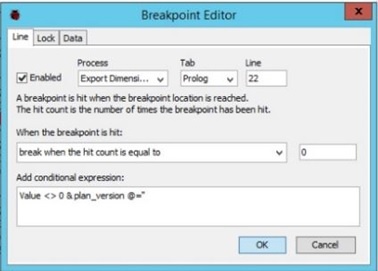
You can also edit breakpoints by going to the breakpoint editor by right clicking on breakpoint panel. You can also give conditional expression to breakpoints or simply select break always, which is the default behaviour of TI Debugger, from the breakpoint editor dialog box. You can also select other pre-existing options or put the conditional expression manually. For an instance, refer to the screenshot below:
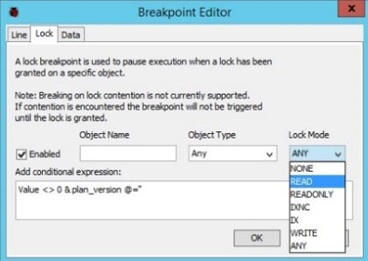
Users also have freedom to specify object locks for breakpoints. A lock breakpoint is used to pause execution when a lock has been granted on a specific object. To specify the object locks, open the breakpoint editor and mention the object name, object type and lock type from the drop down menu.
Written by:
Ismail Syed [TM1 Consultant]
.jpg?width=211&name=logo%20(1).jpg)


Leave a comment