The much awaited major release of Workspace is out now. The new version Planning Analytics Workspace 2.0.57 is available for download for on premise installs. Cloud version will follow in Mid October. Planning Analytics Workspace was released on 11th December 2015. This new look and feel and the features like workflow, AI forecasting, the rich visualisations and virtual dimensions + the features TM1 was born with - the write back, On the fly Consolidations and excel integration will now take TM1 to the next level... TM1 is putting the final nail in the coffin for its competitors!
Here is a bit more detailed look at the new release
Improved Look & Feel
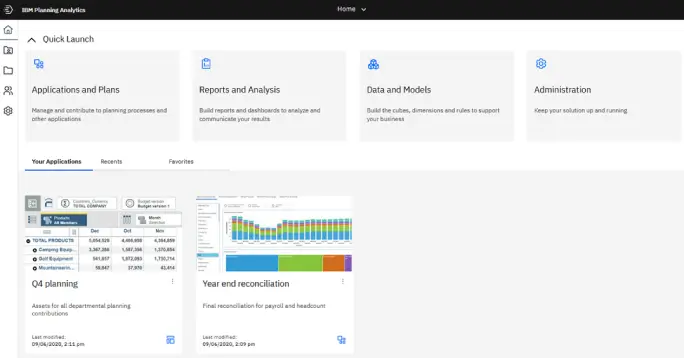
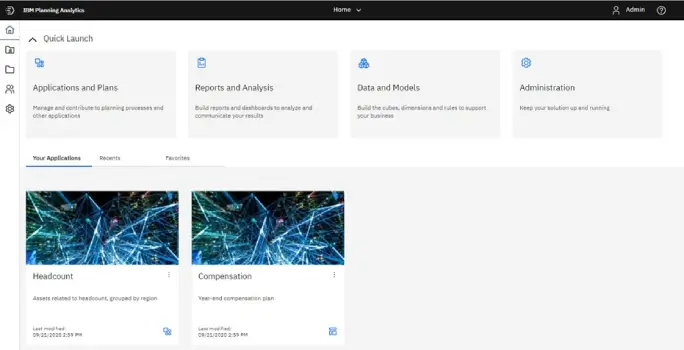
The PA Workspace user interface has received a significant update and brings it closer to Cognos Analytics. This is how the home page now looks. This is customised for your role within PA Workspace and allows quick access to your applications, plans, favorites and recent items. Your view of homepage is dependent on your access level.
- Application & Plans
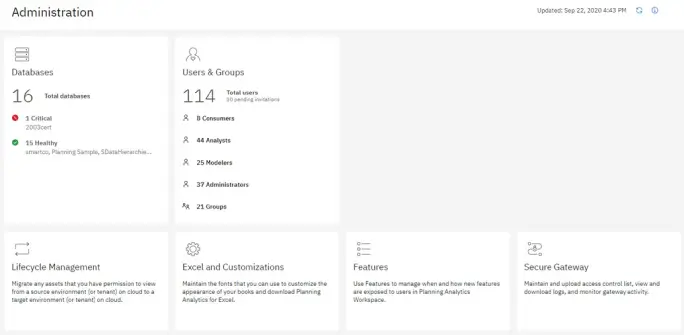
- Administration Page Changes
- Forecasting
- Book and Visualisation improvements
- Cognitive Learning Pane
- Considerations before upgrading to Planning Analytics Workspace 2.0.57 SC
This gives us workflow functionality with an option to set up due date and submission for each asset. (Asset can be a book, view or websheets). Many of us have been waiting for this feature to be released to allow overlaying workflow mechanism over budgeting and planning models.
- Applications
An application contains related assets, such as books, views, and websheets, that are grouped in sections. These sections might reflect the structure of your organization, planning and budgeting requirements, or any other relevant grouping of assets. While an application contains logically related assets, there are no implied or required actions associated with the assets or sections in an application.
- Plans
A plan contains assets that are grouped in steps. These steps can represent discrete tasks or contributions that must be completed in a planning or budgeting process. Each step in a plan must be completed by contributing data to the books, views, and websheets in the step.
This page has been redesigned to provide a greater insight into your environment and to simplify access to Admin tasks. The Administration page now includes several task-specific tiles. The Databases tile provide quick insight into the health of your databases. The Users and Groups tile lets you know how many users are assigned to each role and the number of groups that are defined.
Planning Analytics is now embedded with AI/Predictive forecasting capabilities. This would make automated forecasting or guided forecasting a breeze.. You can forecast in Planning Analytics Workspace by using automated tools that model time-dependent data. Automated model selection and tuning makes forecasting easy to use, even if you are not familiar with time series modeling.
Forecasts and their confidence bounds are displayed in visualizations as a continuation of historic data. You can also view the statistical details for generated models if you want to see the technical background.
Specifying time series in forecasts often requires data manipulation. Planning Analytics Workspace supports a wide range of time series without the need for manipulation, ranging from standard date and time types, to nested periodic and cyclical time fields. When data is recognized as a time series, data preparation is automated. Appropriate trend and seasonal periods are detected, and models are selected from a set of nine different model types.
You can forecast in line, bar, and column visualizations. Forecasts and confidence bounds are computed for each time series, and displayed in the visualization as extensions of the current data. You can inspect each time series separately, and tailor the forecast and results to your own data and requirements.
All objects in a book, such as explorations, visualizations, buttons, images, and text, can now be precisely managed using an expanded selection of properties.
When you select an object in a book and then click the Properties tab, you'll see an expanded list of properties that you can set to manage the object in your book. The properties available vary by object type, and the properties you're familiar with are still available, but new properties allow you to precisely manage the size, position, alignment, and appearance of all objects in a book. You can also set Dashboard properties to manage the general appearance of your book.
Visualizations
The list of visualizations available in Planning Analytics Workspace has been expanded to include twenty five options. Note that Waterfall Chart is now available.
A improved Cognitive engine to help with your searched and queries. he cognitive help tailors your help experience based on where you are working in the product and finds only the answers that are relevant to your user role. You can find the latest videos, blogs, and documentation.
Do note that this update has just been released and we have not fully tested it yet. However the release notes
Features not supported in initial 2.0.57 SC release
These features are not supported in the initial new experience Planning Analytics Workspace 2.0.57 SC release. Support for these features may be reintroduced in subsequent releases.
- Metrics charts/Scorecarding (Impact Diagram, Strategy Map, Custom Diagram) are not supported.
- Tree map visualizations upgrade successfully except when more than one dimension is present on an axis, in which case the tree map is converted to an Exploration during book upgrade.
- The Reports and Analysis landing page does not display individual tiles for books, views, or websheets. Rather, the Reports and Analysis landing page displays a searchable and sortable list of all assets.
- Mobile devices are not fully supported in the initial new experience release, as some gestures are not yet implemented.
- An Administrator cannot set up a global color palette.
- When you click Share > Export, you cannot share a book or view as an image or PowerPoint document. You can, however, export as PDF with enhanced print options.
- The Intent bar (sometimes called the NLP bar) is not available in this release.
Differences in behavior between Planning Analytics Workspace 2.0.57 SC and Planning Analytics Workspace Classic
- Chats are deprecated, as previously announced in this deprecation notice.
- Bookmarks and history are no longer available on the Content tree/Data tree. Instead, you can use the Recents or Favorites tabs on the Planning Analytics Workspace Home page to open assets that you have recently viewed or favorited.
- Collections has been changed to Pins. You can pin a view or websheet from a book.
Source : https://www.ibm.com/support/knowledgecenter/


Leave a comment