 0
0
 19 August 2025, 7:56:19 pm AEST
 3 min
3 min

 0
19 August 2025, 7:56:19 pm AEST
3 min
0
19 August 2025, 7:56:19 pm AEST
3 min

IBM Planning Analytics has introduced new features that make development and administration tasks much easier. Two of the most impactful improvements are the ability to see variable values while debugging TI processes and the enhanced Database Explorer.
IBM Planning Analytics has introduced new features that make development and administration tasks much easier. Two of the most impactful improvements are the ability to see variable values while debugging TI processes and the enhanced Database Explorer.
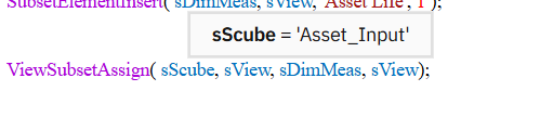
Debugging TI processes used to mean adding log statements and rerunning processes just to see variable values. With the new hover help, simply move your mouse over a variable in the debugger, and its value is displayed (e.g., sCube = 'Asset_Input').
✅ Benefit: Makes debugging much faster, eliminates extra logging, and helps you quickly confirm whether variables are behaving as expected.
Figure 1: Hovering over a variable shows its value instantly in the TI debugger
Managing a Planning Analytics server or instance often involves checking how many objects exist—be it cubes, dimensions, processes, chores, or control objects. Previously, administrators and developers had to dig through folders or rely on TI scripts to gather this information. Now, with the Database Explorer, everything is accessible in one clean interface.
Key features include:
✅ Benefit: The Database Explorer improves transparency and efficiency, helping both administrators and developers work faster by providing a unified view of objects and their data sources.
Figure 2: Navigation through the Database Explorer menu
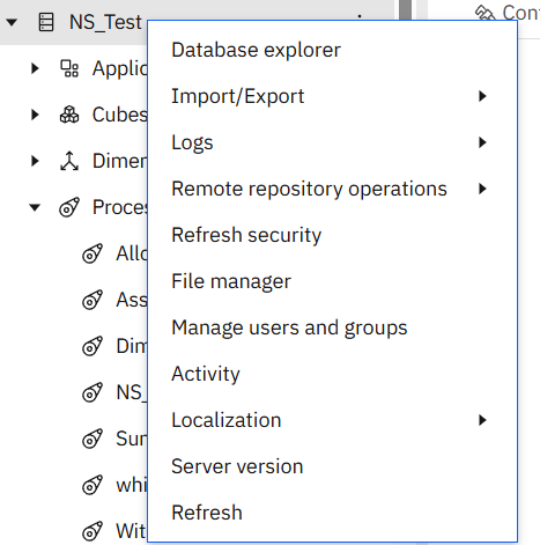
Figure 3: Object counts displayed in Database Explorer
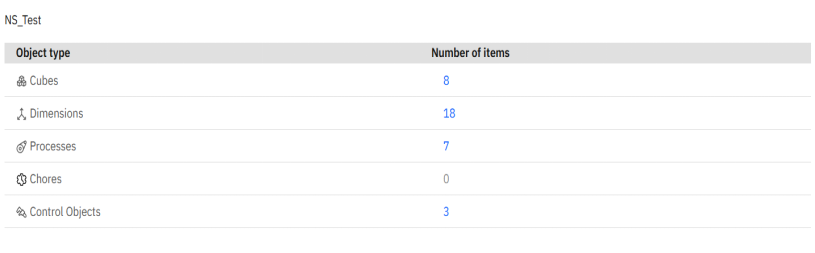
Figure 4: Shows Data source when clicked on Processes

These updates may seem minor, but they greatly improve user productivity. From instantly checking variable values in debugging to exploring databases more efficiently, IBM Planning Analytics is now smarter and more user-friendly.

Subject-matter specialist at Octane Solutions, helping Australian enterprise finance teams optimize planning, analytics, and automation.
 print
print


Leave a comment