<img src="https://trc.taboola.com/1278851/log/3/unip?en=page_view" width="0" height="0" style="display:none">
finding octane
Content_Cut_Icon Twitter_Brands_Icon

6 Reasons why you should get DataFusion - a TM1 connector

Mode_Comment_Icon_white0
Alarm_Icon_1_white3 min

DataFusion is a TM1 connector developed by Octane. It was borne out of the frustration clients were facing extracting data out of their IBM Planning Analytics application into other enterprise Reporting tools like Power BI, Tableau and Qlik. Typically this was set up as a manual task that required an IT or Finance person to drop a csv and upload into Reporting tools. This created a number of ...

down-arrow-blue
Book_Open_Solid_Icon

DataFusion is a TM1 connector developed by Octane. It was borne out of the frustration clients were facing extracting data out of their IBM Planning Analytics application into other enterprise Reporting tools like Power BI, Tableau and Qlik. Typically this was set up as a manual task that required an IT or Finance person to drop a csv and upload into Reporting tools. This created a number of issues. Firstly it required the operator to ensure that the correct slab of data has been captured and uploaded. It also created a risk as end users would have to rely on operator to perform this task on as regular basis as required. This created a single person dependency and if he or she is on leave the data may not get refreshed as teams scramble to find out how to do this task.


The other issue with this approach was a lack of consistency. Being manual the end users would not have a clear idea of when the data from Planning analytics was uploaded. There also was a constant reconciliation issue as numbers would move in Planning Analytics TM1 and would not be reflected in the Reporting tools in a timely manner.


Enter Data Fusion – This is a Planning Analytics TM1 connector Octane has developed to solve this problem. This allows your Planning Analytics TM1 to connect to all major Reporting tools (Power BI, Tableau and Qlik). Datafusion comes with an easy to navigate admin portal to allow admin to set up the data block amongst frequency of data flow to reporting tools. End users can be given access to load data on an ad hoc basis if required. Datafusion uses TM1 security for data access.


Datafusion not only brings in the updated Data but also metadata so if you have a new element like a store/division or region in you Planning Analytics TM1 it will flow through to your reporting tool automatically.


  1. Data Accessibility

Quick and direct data accessibility from all major reporting tools. Ensure your reporting tools across enterprise are reporting on the most up to date data and everyone is using the same numbers for reporting

  1. Automation

Set up the connector once and it runs automatically. All processes are automated and requires no human intervention for scheduled runs.

  1. Efficiency

Reduces the turnaround time of the data refresh process by direct and automated process. Also eliminate all your reconciliation issues with varying numbers between Planning Analytics TM1 and your Power BI’s, Tableau and Qlik.

  1. User friendly design

Easy to use interface and quick setup. Fully supported by Octanes Support teams.

  1. Data Flexibility

Flexible enough to extract any new records with new elements built. Bring in data and metadata and have it displayed in your reports automatically

  1. Eliminate Data issue

There is zero manual handling of data and almost fool proof for your data reconciliations and traceability of data in your Reports.


If you are using Planning Analytics TM1 and taking data out using csv or any other manual method then you should contact us for a demo to see how DataFusion can automate this process for you.


Connect TM1 to Power BI


Leave a comment

Line

Drill Down Using Slicer in Power BI

Mode_Comment_Icon_black5
Alarm_Icon_14 min


PA   powerbi-1 (1)

This article shows how to drill down to the next level in a visualization within Microsoft Power BI, when a filter is applied using a Slicer.

This could be applied even if multiple selections are made within the slicer.

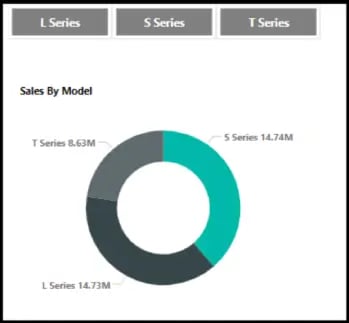
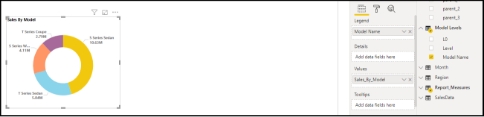
For example – We have a car with 3 model series (L Series, S Series, T Series) in the slicer. Business requires to show the values at this level when no selection is made. Once a selection is made, the visual should show the next level in the hierarchy.

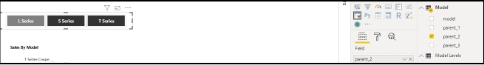
Visualisation without any filter selected (Shows the top level):


G1-1


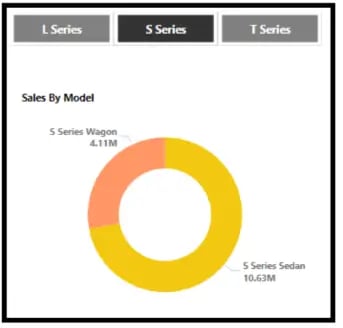
Visualisation with single filter selected (Shows the next level for S Series):


G2-1
 

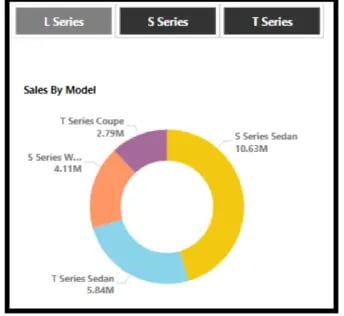
Visualisation with multiple filters selected (Shows the next level for S Series & T Series):


G3-1


In order to achieve the above in Power BI, follow the below steps,

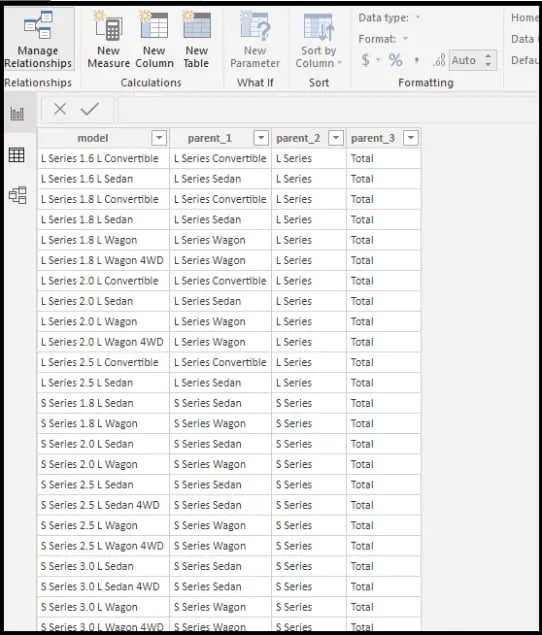
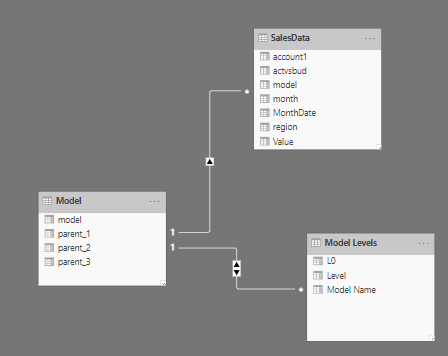
Step 1: We have a ‘Model’ hierarchy setup in Power BI. The hierarchy was imported in Power BI using Octane connector from TM1. You could use any other hierarchy setup.

Lowest level is ‘model’ column with unique model names.


G4-1


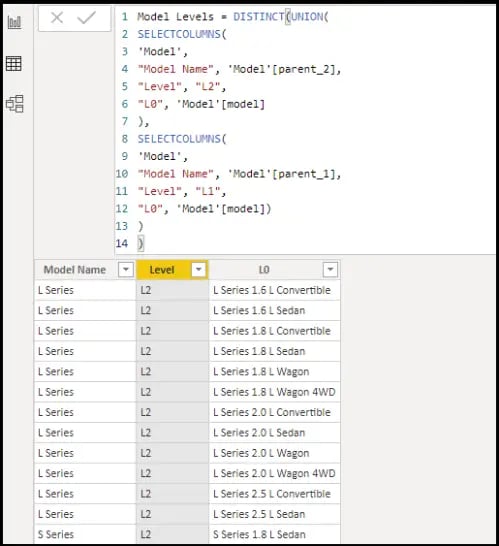
Step 2: Create another table ‘Model Levels’ (used in this example) with 3columns from the above hierarchy in Step 1; 1st column being the Parent 2 & Parent 1; 2nd Column if Parent 2 then value is ‘L2’ else ‘L1’; and 3rd column being the lowest level model names.


G5-1


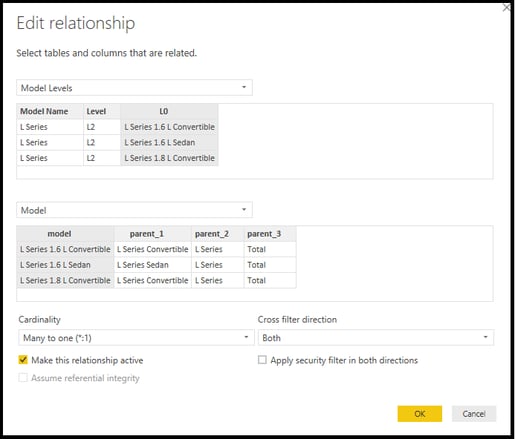
Step 3: Create a relationship between ‘Model’ & ‘Model Levels’ table with the lowest level model names. Select ‘Both’ in Cross Filter direction while creating the relationship.


G6
 
G7-1


Step 4: Create a measure ‘Sales_By_Model’ which calculates the actual value depending on the filter selections. If its selected, It drills to the next level, else, shows the top level.


G8-1


Step 5: Create a slicer using Parent 2 from the original ‘Model’ hierarchy table.


G9-1


Step 6: Create a visualisation using the Model Name (Parent 2 or Parent 1) from ‘Model Levels’ table created in Step 2 and for values, use the measure created in Step 4.


G10-1


New call-to-action

Got a question? Shoot!

Lorem ipsum dolor sit amet, consectetur adipiscing elit, sed do eiusmod tempor incididunt ut labore et dolore magna aliqua.

Get more articles like this delivered to your inbox