Balancing Flexibility and Standards - IBM Cognos TM1 Govern Data Discovery The world of data has infinite variety…and infinite requirements. No single analytics solution will please everyone. But it is possible to combine the strengths of complementary solutions to help meet the needs of both enterprise IT personnel who crave data governance and the end business users who are hungry for ...
- Data Governance IBM Cognos
- Integrating transactions logs to web services for PA on AWS using REST API
- IBM TM1 Cognos user experience white paper 2022
- A TM1 Guide on How To for Dummies
- How CFOs can improve a company's efficiency by automating the process
- Take complexity out of Excel and systemize data with IBM Cognos TM1
Balancing Flexibility and Standards - IBM Cognos TM1 Govern Data Discovery
The world of data has infinite variety…and infinite requirements. No single analytics solution will please everyone. But it is possible to combine the strengths of complementary solutions to help meet the needs of both enterprise IT personnel who crave data governance and the end business users who are hungry for self-service. IBM offers different flavors of analytics to bring you the best side-by-side experience.
In today’s blog, I would like to focus on IBM Cognos TM1 Planning Analytics - a unique union of data governance reporting and dashboards coupled with smart data discovery that just about anyone can use. With self-service, cognitive insight, visualisation, data governance, reporting and sharing, this blended analytics solution is bigger than the sum of its parts.
IBM Cognos TM1 Planning Analytics
IBM has completely redesigned its IBM Cognos BI products to focus on business users and strike a better balance between governance and discovery. The recent solution is and all-Web product that runs either in the cloud or on-premises and provides a more intuitive and guided user interface that makes it easy for business users to interact with and create content.
One of the striking features of IBM Cognos TM1 Planning Analytics is its personalisation and guided analytics tools. The product provides a single interface that gracefully exposes functionality as users evolve from content consumption to creation. Authorised users can open a report, dashboard or model, make changes and store the result for personal use or share it with others.
When using TM1 for reporting /dashboarding customers can be confident that data is validated and can be audited back to the source. Even in a distributed enterprise model TM1 is usually architected to be the single source of truth.
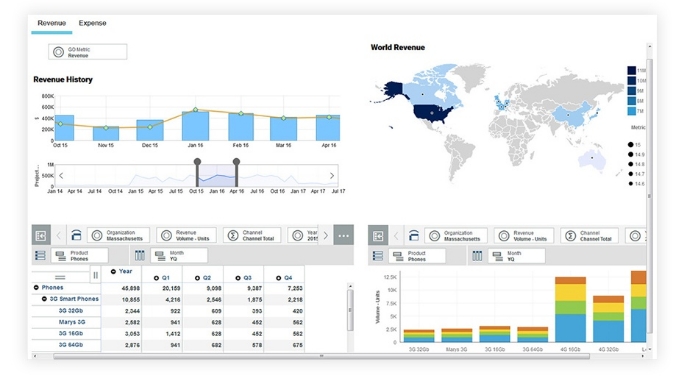
Intent- Driven Authoring
Consumers can not only interact with predefined reports and dashboards, but they can create new content using “intent-driven” authoring environment that uses a search interface to automatically generate visualisations based on keywords entered by users. Unlike other self-service BI tools, users don’t have to drag and drop metrics and dimensions onto chart axes to configure visualisation; IBM Cognos TM1 Planning Analytics does this automatically just from the text users type into a search bar.
Intent-Driven Modeling
Besides auto-generating visualisations, IBM Cognos Analytics uses search to auto-generate modeled data sets that blend data from multiple sources. Called intent-driven modeling, the new feature enables IBM Cognos Analytics users to type in keywords to generate a data model for a new data set. Intent-driven modeling takes ease of use and self service to an extreme, enabling casual users to create new data sets from which they can build custom visualisations using intent-driven authoring.
Another noteworthy feature of IBM Cognos TM1 Planning Analytics is on-demand toolbars and menus in report authoring mode, which pop up as users click on data, exposing available functions, such as filter, sort, calculator and so on. Rather than overwhelm users with features and functions, IBM uses toolbars to put BI functionality at users’ fingertips simplifying the BI experience and making it easier to navigate and interact with data.
Conclusion
IBM has been a mainstay of the BI market since it acquired Cognos in 2008. With IBM Cognos TM 1 Planning Analytics, IBM is determined to lead the market in ease of use and guided analytics. New self-service features make it easier for business professionals to create data sets and reports for personal and shared consumption.
In this blog post, we will showcase the process of exposing the transaction logging on Planning Analytics (PA) V12 on AWS to the users. Currently, in Planning Analytics there is no user interface (UI) option to access transaction logs directly from Planning Analytics Workspace. However, there is a workaround to expose transactions to a host server and access the logs. By following these steps, you can successfully access transaction logged in Planning Analytics V12 on AWS using REST API.

Step 1: Creating an API Key in Planning Analytics Workspace
The first step in this process is to create an API key in Planning Analytics Workspace. An API key is a unique identifier that provides access to the API and allows you to authenticate your requests.
- Navigate to the API Key Management Section: In Planning Analytics Workspace, go to the administration section where API keys are managed.
- Generate a New API Key: Click on the option to create a new API key. Provide a name and set the necessary permissions for the key.
- Save the API Key: Once the key is generated, save it securely. You will need this key for authenticating your requests in the following steps.
Step 2: Authenticating to Planning Analytics As a Service Using the API Key
Once you have the API key, the next step is to authenticate to Planning Analytics as a Service using this key. Authentication verifies your identity and allows you to interact with the Planning Analytics API.
- Prepare Your Authentication Request: Use a tool like Postman or any HTTP client to create an authentication request.
- Set the Authorization Header: Include the API key in the Authorization header of your request. The header format should be Authorization: Bearer <API Key>.
- Send the Authentication Request: Send a request to the Planning Analytics authentication endpoint to obtain an access token.
Detailed instructions for Step 1 and Step 2 can be found in the following IBM technote:
How to Connect to Planning Analytics as a Service Database using REST API with PA API Key
Step 3: Setting Up an HTTP or TCP Server to Collect Transaction Logs
In this step, you will set up a web service that can receive and inspect HTTP or TCP requests to capture transaction logs. This is crucial if you cannot directly access the AWS server or the IBM Planning Analytics logs.
- Choose a Web Service Framework: Select a framework like Flask or Django for Python, or any other suitable framework, to create your web service.
- Configure the Server: Set up the server to listen for incoming HTTP or TCP requests. Ensure it can parse and store the transaction logs.
- Test the Server Locally: Before deploying, test the server locally to ensure it is correctly configured and can handle incoming requests.
For demonstration purposes, we will use a free web service provided by Webhook.site. This service allows you to create a unique URL for receiving and inspecting HTTP requests. It is particularly useful for testing webhooks, APIs, and other HTTP request-based services.
Step 4: Subscribing to the Transaction Logs
The final step involves subscribing to the transaction logs by sending a POST request to Planning Analytics Workspace. This will direct the transaction logs to the web service you set up.
Practical Use Case for Testing IBM Planning Analytics Subscription
Below are the detailed instructions related to Step 4:
- Copy the URL Generated from Webhook.site:
- Visit siteand copy the generated URL (e.g., https://webhook.site/<your-unique-id>). The <your-unique-id> refers to the unique ID found in the "Get" section of the Request Details on the main page.

- Subscribe Using Webhook.site URL:
- Open Postman or any HTTP client.
- Create a new POST request to the subscription endpoint of Planning Analytics.
- In Postman, update your subscription to use the Webhook.site URL using the below post request:

- In the body of the request, paste the URL generated from Webhook.site:
{
"URL": "https://webhook.site/your-unique-id"
}
<tm1db> is a variable that contains the name of your TM1 database.
Note: Only the transaction log entries created at or after the point of subscription will be sent to the subscriber. To stop the transaction logs, update the POST query by replacing /Subscribe with /Unsubscribe.
By following these steps, you can successfully enable and access transaction logs in Planning Analytics V12 on AWS using REST API.
This white paper was written to describe the level of self-service users can expect from TM1. Download the full white paper in PDF below.
This white paper was written to describe the level of self-service users can expect from TM1.
To understand what users can expect from TM1, imagine your organisation’s finance office is a house. In this house, users are busy building different kinds of rooms. Popular rooms include budgeting and forecasting. In an adjacent room, analysis of financials is taking place. Down the hallway a report is being created.
In addition to the rooms, there is furniture and of course, a foundation. The distinction between the rooms and the foundations is important. Without a strong foundation, the rooms will collapse upon themselves. Adding new rooms would be made difficult, as the added weight may not be supported by the structure.
While users build and carry out activities in the rooms, it is the foundations where the engineers or better still, TM1 developers, work. TM1 developers are busy ensuring there is no unnecessary duplication in the foundations. We call this governance. Developers also ensure the foundations are built with integrity so TM1 is efficient and runs lean.
To keep your instance of TM1 running, you will need both users and developers.
Contents
- How to Create Dynamic Parameters for TM1
- How to Build a Scorecard using TM1 Architect
- How to Enhance TM1 Security on a 'Need to Know' Basis
- How to Use Stargate Views for TM1 Cube Viewer
How to Create Dynamic Parameters for TM1
The CheckFeedersMaximumCells is a dynamic parameter that allows users to restrict and control performing check feeders operation in a cube for a selected number of cells. As per the documentation, the default value is 3,000,000, meaning feeders for consolidation with up to 3 million intersections could be checked against, by default.
Case in point: I’ve added the CheckFeedersMaximumCells parameter in tm1s.cfg file and set the value to 1, implying that the Check Feeders should only apply to not more than 1 cell.
CheckFeedersMaximumCells =1
Post the change, let’s look at real life results of adding this parameter:
In the above screenshot, I’ve performed a Check Feeder operation on one cell and it aptly shows the result.
However, if I were to do the same on a consolidation, “PG1”, it throws an error as illustrated in the screenshot below.
.jpg?width=334&height=341&name=dynamic%20parameters%201%20(1).jpg)
Note 1: If the intersections or parameter value exceeds 99, the number format is displayed in scientific notion.
Note 2: If you would like to effectively disable checking feeders for whatever reason, you can do so by assigning -1 value for the config parameter.
How to Build a Scorecard using TM1 Architect
Cube used: Sales_Plan
Dimensions: Subsidiaries, Channel, Product, Month, Versions and Sales_Plan_Measures
To Add Traffic Lights in TM1 Architect follow the steps:
1. Enhance the Metrics Dimension
A Metric Dimension contains your collection of important measures or key performance indicators (KPI) that you want to monitor in your business.
- Add 2 Attributes (Numeric) in ‘Sales_Plan_Measures’ Dimension namely ‘Performancepattern’ and ‘Tolerancetype’.
- Enter a value of 2 for ‘Unit Cost’ element in ‘Tolerancetype’ Attribute and let rest of the elements be 0.
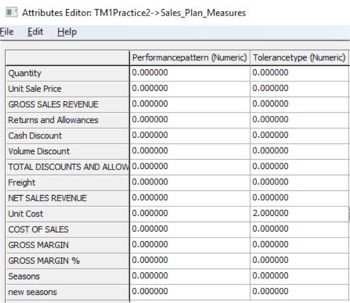
2. Enhance the indicator dimension
Scorecarding, a Metric indicators dimension provides more information about your key performance indicators (KPI) or metrics. Examples of metric indicators include Score, Status, and Trend.
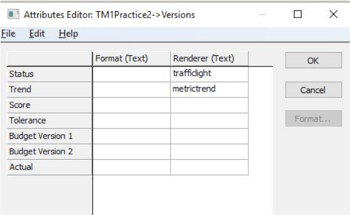
- Insert a New Attribute in ‘Versions’ Dimension and name it as ‘Renderer’.
- For Status member enter the ‘Renderer’ value as ‘trafficlight’.
- For Trend member enter the ‘Renderer’ value as ‘metrictrend’.
3. Enhance Time Dimension
- Enter a New Attribute in ‘Month’ Dimension and name it as ‘Previous’.
- Populate the ‘Previous’ Attribute with the invariant name of the preceding period from the level. (Example: For Feb enter ‘Jan’and so on).
How to Create a TM1 Security Overlay
Security Overlay is a type of cell security which restrict user’s ability to write to a cube, without causing change on the dimensions and without needing to change the underlying TM1 Security. Security Overlay prevent updates to cell data by all users, except Administrater.
Using Security Overlay Cube you can define the restriction to only selected dimensions of the Cube, as with Cell Security. Security Overlay does not apply to an Admin User, whereas the Cell Security can be applied to Admin including other users.
The Security Overlay cube is prefixed just like other Security Cubes.
} SecurityOverlayGlobal_CubeName
Security Overlay cube contains all the mapped dimensions from the cube and the last dimension is the ‘}SecurityOverlay Dimension’.
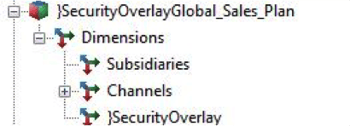
}SecurityOverlay dimension defines the data stored in the Overlay cube. It contains a single string element called ‘OverlayData’, which stores the data that is used to implement the Overlay. In OverlayData value ‘1’ must be entered to restrict write access in all intersections corresponding to the dimensions in Security Overlay cube.
To create Security Overlay cube via TI, use ‘SecurityOverlayCreateGlobalDefault’ function must be used.
This function can be called either in metadata or prolog tab as the functions that updates or create security must not be used in Data or Epilog tabs
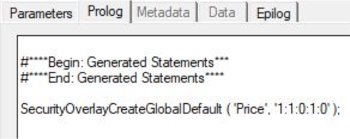
As per the above screenshot the price refers to the cube name. There are 5 dimension in the Price cube. Number ‘1’ indicates that the dimension is included in the Security Overlay cube and ‘0’ indicate the dimension is excluded.
As per the TI function in above screenshot it creates a Security Overlay cube with 1st, 2nd and 4th Dimensions.
Below is the screenshot of the Security Overlay Cube View
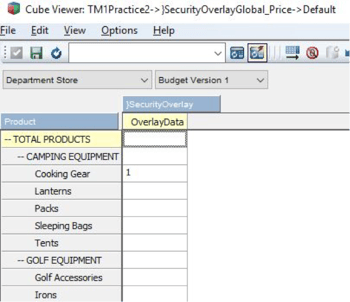
As per the above screenshot populated value 1 is entered in the intersection of ‘Department Store’, ‘Budget Version 1’ and ‘Cooking Gear’ which results in giving read access for all the intersections that has ‘Department Store’, ‘Budget Version 1’ and ‘Cooking Gear’.
Below is the snapshot of how the Security Overlay Cube View looks like after applying Security Overlay to the other users
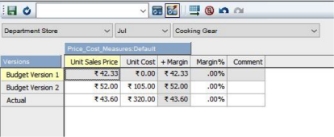
As per the above screenshot the intersection of Department Store, Cooking Gear and Budget Version 1 is not editable and all the other cells are editable.
The way Security Overlay Security diffrenciates from TM1 Cell Security is that TM1 Cell Security can be given different privileges like READ, WRITE, LOCK, NONE, RESERVE and ADMIN, whereas in Security Overlay Cube everyone is given READ access except the Admin. Cell Security can be given to all users including Admin.
There is no requirement to execute any process after u update the Overlay Security Cube and the impact of cell security comes into effect immediately. There will be no time lag or need of refreshing the security.
‘SecurityOverlayGlobalLockNode’ function must be used to restrict the access rights of a node to read-only by locking it.
Security Overlay Cube can be deleted or destroyed using a ‘SecurityOverlayDestroyGlobal’ Turbointegrator function.
To create Cell Security cube via TI, use ‘CellSecurityCubeCreate’ function must be used, similarly to ‘CellSecurityCubeDestroy’ function can be used to destroy Cell Security Cube.
How to Use Stargate Views For TM1 Cube Viewer
A Stargate View is a subsection of TM1 cube which is created by TM1 when you browse a cube with the Cube Viewer. It is also known as ‘View Cache’. Stargate View is different from a TM1 view object, and hence does not contain the formatting information and browser settings that are available in a view object.
Stargate View helps in accessing the cube data more rapidly than the TM1 object (Actual Cube View). Stargate View contains only the data for a defined section of a TM1 cube.
Stargate View contains only the data defined by the title elements and row and column subsets.
TM1 stores a Stargate view when you access a view that takes longer time to retrieve than the threshold defined by the VMT property in the }CubeProperties control cube. If a VMT value is not defined, a Stargate view will get generated when a view takes longer than five seconds. This is the default threshold when VMT is not specified in the }CubeProperties control cube.
A Stargate view persists in memory until the browser view from which it originates remains unchanged. If the view is changed and you recalculate the browser view, TM1 replaces the existing Stargate view in memory with the new one based on the recalculated view.
TM1 removes the Stargate View or Cache when you close the browser view and it will also be removed if you restart the TM1 Application.
TM1 provides some settings to control the Stargate View namely VMT (View Minimum Time) and VMM (View Maximum Memory), which can be seen in ‘}CubeProperties’ control cube.
VMM is expressed in KB. If we don’t specify any value, then a default value of 128 is used.
VMT is in seconds. If no value is specified, then a default value of 5 is used.
Try out our TM1 $99 training
Join our TM1 training session from the comfort of your home
As the CFO of your company, your organisation relies on you for more than just numbers. Yes, spreadsheets and financial reports are the hallmarks of your profession.
But what about business intelligence and forecasting?
Today, the explosion of data available in business matches the explosion of competition in today’s markets and CFOs need to harness that wealth of data to compete. CFOs need better business intelligence tools to identify upcoming opportunities and grab them before their competitor does. They also need to foresee potential losses and advise on how to mitigate risk. In short, they need to focus on analytics to be able to predict the future so their business owners can react quickly.
Predicting the Future with Business Intelligence Solutions
.webp?width=628&name=How-CFOs-can-improve-a-companys-efficiency%20(1).webp)
Despite the high tech dashboards available, many CFOs are still trying to reach high performance using acquainted tools like Excel. Ashamed of trying to compete in the hottest markets, many CFOs feel like they’re trying to build a fire with flint and steel.
The CFOs of advanced companies are no longer content to see their staff pumping out spreadsheets that need hours of explanation and analysis. With the overwhelming amount of data available, better business intelligence and reporting demand sophisticated tools to drive a company from the base camp to the summit. CFOs must be able to visualise inter-relational data groups, see the connection among KPIs, identify the potential for profit and envision the future while strategising.
What they need to boost performance is a financial reporting dashboard to accumulate data from different business units and provide insights into alternative strategies. Once various data sets are connected visually, patterns emerge, extrapolation is possible, and the future seems clearer.
So why should CFOs reassess their current Business Intelligence tools?
Because they know they are wasting time creating graphs and spreadsheets. Creating confounding reports doesn’t compare business metrics at a glance and in the end, they know they can improve efficiency by having visual data immediately accessible to key business units.
Recently, Octane Software Solutions launched the FREE Business Intelligence Assessment to help companies gain more value from their current BI and analytics investments as well as provide road mapping to create cost effective BI strategies.
Find out more: http://info.octanesolutions.com.au/ibm-cognos-tm1
IBM Cognos TM1 supported by Planning Analytics is the ideal technology for making Excel-centric budgeting, forecasting, financial reporting and any spreadsheet-based analytical application scale to the enterprise.
IBM's TM1 for Microsoft Excel brings the power and familiarity of Excel to the arena of modern enterprise performance management. Planning Analytics, on the other hand, enables business and financial analysts, line-of-business managers and others to explore and analyse data from a variety of different sources—including IBM Cognos TM1 and IBM Cognos Business Intelligence—without IT support.
Thanks to IBM Planning Analytics, Microsoft Excel users can:
1. Explore and analyse data
- Use one add-in to analyse all your data: dimensional or relational, performance management or business intelligence, proprietary IBM data or third-party sources.
- Drag and drop members, dimensions and views from the metadata tree of the company's TM1 model directly into spreadsheet columns or rows using the Exploration interface.
- Link and refresh planning and operational data sources in the same Excel worksheets, by connecting to Cognos TM1 and Cognos Business Intelligence through a single analysis interface.
- Select and filter data, then define layouts to gain a managed view of information through a single, intuitive interface.
2. Systemise data
- Use Microsoft Excel capabilities to enrich business scenarios and present results that are easy to understand and reuse.
- Create objects in Cognos TM1 models and reuse them in the spreadsheet environment of IBM Planning Analytics.
3. Share results
- Publish Cognos Business Intelligence-sourced reports, including new column and row calculations, in standard Cognos reports and dashboards.
- Engage teams and individuals from across the organisation for more inclusive and representative decision-making and analysis.
- - Deliver analysis results to the processes and people at the front line of the business.
4. Extend analysis capabilities
- Extend access to Cognos TM1 data to a broader range of users to improve their decision-making.
- Perform flexible analysis and solve business problems using familiar spreadsheet tools and techniques.
- Analyse data from different sources and build reports and dashboards without the need for IT assistance.
- Build control panels to make it easy to change information in a report with a single click.
If you would like to find out more about IBM Planning Analytics and IBM Cognos TM1 capabilities, give us a call and let's discuss the future of your business.
we go the extra mile so you can go the distance|
Got a question? Shoot!
Lorem ipsum dolor sit amet, consectetur adipiscing elit, sed do eiusmod tempor incididunt ut labore et dolore magna aliqua.


.png?width=673&height=371&name=IBM_Gold-removebg-preview%20(1).png)
Leave a comment