Predictive analytics: Predictive analytics is the practice of extracting information from existing data sets in order to determine patterns and predict future outcomes and trends. A way to predict the future using data from the past. Predictive analytics brings together advanced analytics capabilities spanning ad-hoc statistical analysis, predictive modelling, data mining, text analytics, ...
- Predictive & Prescriptive Analytics: IBM Decision Optimisation
- What's new in Cognos Analytics 12.1.x
- Transform Enterprise Performance with IBM Analytics and AI Solutions
- The CFO's AI Playbook : From Ah-Ha to Acceleration
- Planning Analytics Administration: An Alert (Proactive Mechanism)
- IBM Planning Analytics (TM1) Vs Anaplan
.webp?width=512&name=unnamed%20(2).webp)
Predictive analytics:
Predictive analytics is the practice of extracting information from existing data sets in order to determine patterns and predict future outcomes and trends. A way to predict the future using data from the past.
Predictive analytics brings together advanced analytics capabilities spanning ad-hoc statistical analysis, predictive modelling, data mining, text analytics, optimization, real-time scoring and machine learning. These are tools that help organizations discover patterns within the data and go beyond knowing what has happened to anticipate what is probable to happen next.
- Use historical information to determine patterns.
- Once equipped with these patterns, predictive models are built and are used to forecast possible trends and outcomes.
- Predictive analytics highlights approaching opportunities and potentials for risk to improve the quality of decision-making around upcoming events.
Prescriptive Analytics:
Prescriptive analytics is the use of technology to help businesses make better decisions in handling specific events by factoring in the knowledge of possible constraints, available resources, past performance and current situation.
Prescriptive analytics involves mathematical and computational algorithms and goes beyond predicting future outcomes by also suggesting actions and to benefit from the predictions and showing the implications of each decision option.
Prescriptive analytics seeks to determine the optimized solution or best outcome among different choices depending on current constraints, resources and priorities. Prescriptive analytics uses both descriptive and predictive data to determine a specific action to take.
Prescriptive Analytics capabilities :
Prescriptive Analytics hold below features
- Prescriptive Modelling
- Uses mathematical and computations models
- Optimized solutions
- Continually take in new data to re-predict and re-prescribe
- Automatically improve prediction accuracy and prescribing better decision options
- Visualization
- Prescriptive analytics incorporates both structured and unstructured data
IBM Decision Optimisation is one such solution from IBM.
IBM Decision Optimisation:
IBM Decision Optimisation is a prescriptive analytics solution that enables organisations in commerce, manufacturing, financial services, healthcare, telco, government and other highly data-intensive industries to make better decisions and achieve business goals by solving complex optimisation problems.
IBM Decision Optimisation solves business problems using Mathematical and Constraint programming.
IBM Decision Optimisation solutions provide features that help create optimization models, either using general programming language APIs, like Python, Java or OPL to solve the breadth of optimization models, using proven and powerful optimization engines.
.webp?width=434&name=unnamed%20(4).webp)
IBM Decision Optimisation is an integral part of IBM Watson® Studio, so users can benefit from all data science features of IBM Watson Studio, like access to machine-learning models, the ability to pass output from predictive analytics to the Decision Optimisation engine, access to open notebook features, visualization features and data connectivity options from IBM Watson Studio.
.webp?width=481&name=unnamed%20(3).webp)
Key benefits
- Powerful optimization engines for faster performance
- Quickly build optimization models using your preferred language
- Access to more data science features
Register for our webinar 'Business Decisions and Resource Allocation' to learn how IBM Planning Analytics with Watson and IBMLOG CPLEX work seamlessly together.
IBM Case Study:
Client:
Leading bulk tanker transportation company.
Business challenge:
To transport bulk products safely and profitably, this carrier needs to manage hundreds of constraints on tankers, drivers and cargos. How can it help its planners make optimal routing decisions?
Transformation:
This leading bulk carrier embedded IBM optimization software into its operational systems and developed a sophisticated solution that provides insight to optimize driver and route planning every 10 minutes
Results:
Millions of dollars saved annually by eliminating miles of unnecessary driving.
Millions more dollars saved annually by improving driver retention.
Million-dollar revenue boost achieved by increasing driver productivity.
Click here for more details.
Products
- IBM ILOG® CPLEX® Optimization Studio
- IBM Decision Optimization for Watson Studio
- IBM Decision Optimization Center
- IBM Decision Optimization on Cloud
- IBM ILOG CPLEX Optimizer for z/OS
Organizational Benefits:
- Optimized solutions to solve business problems.
- Greater ease-of-use.
- Comprehensive analytics capabilities
- Movement to the cloud
- Increased adoption beyond financial services
- Overall market growth.
- Open source integration
- A flexible and scalable platform for one-to-many analytics.
Hope you have enjoyed reading this blog as much as I had testing this cool feature; stay tuned for upcoming blogs.
You may also like reading “What is IBM Planning Analytics Local ”, “IBM TM1 10.2 vs IBM Planning Analytics”, “Little known TM1 Feature - Ad hoc Consolidations”, “IBM PA Workspace Installation & Benefits for Windows 2016”.
For more information: To check on your existing Planning Analytics (TM1) entitlements and understand how to upgrade to Planning Analytics Workspace (PAW) reach out to us at info@octanesolutions.com.au for further assistance.
Octane Software Solutions Pty Ltd is an IBM Registered Business Partner specialising in Corporate Performance Management and Business Intelligence. We provide our clients with advice on best practices and help scale up applications to optimise their return on investment. Our key services include Consulting, Delivery, Support and Training.
Octane has its head office in Sydney, Australia as well as offices in Canberra, Bangalore, Gurgaon, Mumbai, and Hyderabad.
To know more about us visit, OctaneSoftwareSolutions.
Dashboards:
Distinction between Display and Use value in dashboards:
You can now define Display and Use values in data modules.
The Display values are the values that you can see in a dashboard UI; the Use values are primarily for filtering logic.
Previously, defining the Display and Use values was possible only in FM packages. This feature brings the same capability to data modules and enhances consistency across dashboards and reporting. You can interact with readable values while filters apply precise underlying identifiers. For example, you can select a Customer ID value in the dashboard UI and apply a filter that is based on the Customer Name value.
Manage filter size and filter area visibility:
You can now resize filter columns and hide filter areas to improve the arrangement and visibility of these elements in dashboards.
For more information on resizing filter columns in the All tabs and This tab filter areas, see Resizing filters.
For more information on hiding and reshowing the filter areas, see Hiding and showing filter areas.
Option for users to export visualisation data to a CSV file:
You can now allow your users to export visualisation data to a .csv file.

To enable this feature, open a dashboard or a report that contains a visualisation, go to Properties > Advanced, and turn on the Allow users access to data option.
When this option is active, users can open the data tray and download the .csv file from the Visualisation data tab. Enabling this feature also adds an Export to CSV button and Export to CSV icon to the toolbar. The button is visible to the users and to the editors. If you turn off this feature, the button disappears.
Responsive dashboard layout:
The 12.1.1 release introduces a responsive layout feature for dashboards.
This feature enhances the authoring experience and usability across different devices by optimising the dashboard layout for various screen sizes, including mobile devices. You can also use it for grouping the content and organising visualisations.
To use a responsive layout, go to the Responsive tab when you create a new dashboard and select one of the available templates, as seen in the following image:

The responsive dashboard layout feature comes with the following key capabilities:
- Layout selection:
You can now choose between responsive and non-responsive layouts when you create a new dashboard.
- Adaptive widgets:
If you change the position of a panel or resize the dashboard window, the widget automatically adapts its placement and alignment.
- Intuitive resizing and swapping:
Smart alignment algorithms facilitate smooth layout transitions, while an intuitive interface makes the authoring experience smoother and more efficient.
- Drop zones for precise widget placement:
Each layout cell supports five drop zones: top, right, bottom, left, and center. You can use these zones for more control over widget placement.
- Cell deletion:
Dashboards now differentiate between empty and populated cells for accurate deletion.
- Data population:
The feature mirrors data population from the non-responsive layouts, supports drag-and-drop function, and slot item selection. If you use the copy and paste or click-add-to functions, the feature uses a smart placement logic to make sure that it adds the content to empty cells. It can also split the data between existing cells.
- Window resizing:
You can now dynamically resize a dashboard and its layout automatically adapts to the new screen size. It includes transition to a single-column or two-column layouts on smaller screens for enhanced readability.
- Printing to PDF files:
You can print the dashboard to a .pdf file in View mode and in the New Page mode.
- Nested dashboard widgets:
You can use the nested dashboard widgets as standard widgets or as containers for grouping and organising the content.
To successfully implement the responsive layout, you must make sure that the dashboard uses manifest version 12.1.1 or later and confirm widget boundaries by employing the layout grid. However, if the widgets do not render correctly, check the layout specification and verify the feature support.
Secure dashboard consumption with execute and traverse permissions:
Users can now consume dashboards with execute and traverse permissions granted to presented data, no read permission is required.
In the previous releases of IBM® Cognos® Analytics, the read permission was required for dashboards consumption. This might cause a sensitive data compromise because dashboard consumers could edit and copy such data.
Important: To strengthen the protection of data that you want to be consumed by other users, modify these users' permissions from Read to Execute and Traverse before you migrate to Cognos Analytics 12.1.1.
However, the execute and traverse permissions put some restrictions on actions that can be taken by a dashboard consumer. Therefore, the consumer cannot perform the following actions:
-
Drill up and down
-
Export
-
Narrative insights
-
Navigate
-
Open dashboards
-
Paste copied widgets into another dashboard.
-
Pin
-
Save
-
Save as a story
-
See the full data set in the data tray.
-
Share
-
Switch to Edit mode.
Personalised dashboard views:
The 12.1.1 release comes with a new feature for simplified customisation of complex dashboard designs.
A dashboard view is a feature that references a base dashboard, which contains your individual filters and settings. It supports the following customisation features:
-
Filters
-
Brushing, excluding local filters on individual visualisations
-
Bookmarks, including the ability to set the currently selected tab
You can create dashboard views only from an open dashboard and from within the dashboard studio, and only against saved dashboards. If the open dashboard is saved, a Save as dashboard view option appears in the save menu:

This operation works as a standard Save as operation. When the operation is complete, the original dashboard is still displayed. To access the new dashboard view, you must open it manually from the content navigation panel.
The dashboard views have a different icon from regular dashboards. It includes an eye overlay, which is similar to a report views icon:

You can customise a dashboard view by changing the brushing, filter, or bookmarks, and then saving the view. However, the dashboard view is essentially in a Consume mode, and you can't switch to the authoring mode. It also means that you can't access the metadata tree of the dashboard view or add extra filter controls to the filter dock. If you want your users to apply filters in a metadata column, you must first add that column to the base dashboard, even if you don't initially select any filter values.
Any updates that you make to a base dashboard automatically appear in the dashboard view, except for the custom options that you define in the dashboard view itself. You can see the changes the next time that you open the dashboard view. For example, if you delete a visualisation from the main dashboard, it no longer appears in the dashboard view.
The Save as dashboard view operation also creates a non-editable bookmark in the dashboard view. This bookmark includes the state of filters and brushing that you applied in the dashboard at the time when the dashboard view was created or last saved. When you open the dashboard view and don't select any other bookmark, this bookmark is automatically selected.

The dashboard views not only consume bookmarks from the base dashboards, but they also can have their own bookmarks. You can create them in the same way as in standard dashboards. The Cognos® Analytics UI differentiates between Shared bookmarks, so all bookmarks from the base dashboards, and My bookmarks, which are bookmarks from the dashboard view.

If you delete the base dashboard, you can't open the dashboard view, and its entry is disabled in the content navigation. All attempts to access that dashboard view by entering its URL address directly into a browser result in an error message. Also, the Source dashboard property appears as Unavailable, for example:

Reporting:
Enhanced clarity of reporting templates view:
Release 12.1.1 enhances the user experience of navigating through report templates.
When you open the Create a report page, it shows only templates that match the Report filter value. This change hides all Active Reports templates by default and makes only the Report templates visible.

You can use the Filter icon to customise your view. To maintain a personalised experience, Cognos® Analytics saves your selection in local storage or by using the cached value.
This enhancement also comes with upgraded filter labels, which reflect the current filter value, for example: Showing All Templates, Showing Report Templates, or Showing Active Report Templates.
Manage queries in the report cache:
You can manage which data queries are included in the report cache to control report performance.
For more information on the report cache, see Caching Prompt Data.
For example, queries to data sources that cannot be accessed by all users, user-dependent, might degrade the report performance.
You can exclude report performance-degrading queries from cached prompt data by setting the value of the Report cache property to No in the query property pane:
-
In the navigation menu, click Report, then Queries in the drop-down menu.
-
In the Queries pane, select a query.
-
In the Properties pane, in the QUERY HINTS section, click the Report cache property.
-
Select one of the following values:
-
Default - the query is included in the report cache
-
Yes - equivalent to the Default value.
-
No - the query is excluded from the report cache.
For multi-level queries, this value is transferred from the lowest-level to the highest-level query.
PostgreSQL audit deployment and model:
The 12.1.1 release comes with a new capability for enhanced auditing and reporting in environments that use PostgreSQL as the auditing database.
You can use a dedicated Framework Manager model and a deployment package to run reports against a PostgreSQL audit database. These resources provide a structure for analysing the audit data and creating insightful reports.
You can access the new samples in the following locations within your installation directory:
<installation>/samples/Audit_samples/Audit_Postgres
<installation>/samples/Audit_samples/IBM_Cognos_Audit_Postgres.zip
To use the PostgreSQL audit samples, make sure to create a data source connection named Audit_PG.
Master detail relationships with 11.1 visualisations:
You can use 11.1 visualisations in master detail relationships to present details for each master query item in a consolidated, insightful way.
For more information on master detail relationships, see Master detail relationships.
For the 11.1 visualisations as the detail objects, you can now choose if the same automatic value range is used in all visualisation instances in a master detail relationship. You apply your choice to the Same range for all instances of the chart option. To turn this option off or on, perform the following steps:
-
Select a visualisation for which a master details relationship is created.
-
In the Data Set pane of this visualisation, click the data item that defines values on the value axis.
-
In the Properties pane, under GENERAL, click the More icon 3 dots in the filter area right of the Value range property.
-
In the Value range window:
-
Select Computed.
-
Turn off or on the Same range for all instances of the chart option, depending on whether you want to use in the instances the global extrema, the biggest value range of all instances, or the local extrema, the value range of each visualisation.
In today’s volatile business landscape, agility is no longer a competitive advantage—it’s a necessity. True agility means moving beyond fast response to actively anticipating market shifts and seamlessly aligning people, processes, and technology to act decisively.
.png?width=595&height=341&name=From%20Insight%20to%20Impact%20(1).png)
Enterprises possess vast troves of data, yet the ultimate differentiator is the ability to transform that data into actionable insights and automated, intelligent decisions. At Octane Analytics, we are driving this transformation across industries by evolving disconnected reporting tools into a unified, intelligent ecosystem powered by IBM's premier analytics and AI platforms.
The Unified Framework for Intelligent Decisions
IBM’s comprehensive suite of solutions—including Planning Analytics, Cognos Analytics, SPSS, Decision Optimisation, Controller, and Watsonx Orchestrate—delivers a connected framework that manages business performance from strategic vision through to operational execution. This integration establishes a data-to-decision continuum where insights fluidly integrate into planning, execution, and automation cycles.
- IBM Planning Analytics moves organisations beyond static budgeting to dynamic, driver-based forecasting and scenario modelling.
- IBM Cognos Analytics empowers business users with AI-driven dashboards and visualisation tools for deep insight exploration.
- IBM SPSS integrates statistical precision and data science into business planning, ensuring predictions are rooted in reliable data, not intuition.
- IBM Decision Optimisation models complex business scenarios to identify the most efficient and optimal outcomes.
- IBM Controller simplifies and automates financial consolidation, closing, and regulatory reporting.
- IBM Watsonx Orchestrate enables non-developers to automate repetitive workflows, directly connecting insights to business action without writing code.
The Pivot to Predictive and Prescriptive Analytics
Many organisations remain reactive, focused on analysing "what happened." The step-change in performance occurs when analytics shift to answering the crucial questions: “what will happen?” (Predictive) and “what should we do about it?” (Prescriptive).
The integrated IBM ecosystem facilitates this critical shift:
-
Prediction Informs Strategy: Predictive models built in SPSS directly inform forecasts within Planning Analytics, making financial and operational plans immediately responsive to market shifts.
-
Prescription Optimises Action: Decision Optimisation identifies the best sequence of actions to achieve a business goal, operating within specified constraints.
-
Automation Operationalises Insight: Watsonx Orchestrate then automates the prescribed follow-up actions—whether triggering workflows in HR, Finance, or Operations—significantly boosting responsiveness and reducing manual workload
This synergy elevates the organisation from merely data-driven to decision-driven, where insights are not just observed but fully operationalised.
AI and Automation: Transforming Finance and Operations
Automation is no longer confined to the IT department. Today, modern CFOs, HR executives, and department leaders are leveraging agentic AI to offload repetitive, high-volume tasks and achieve new levels of efficiency.
Consider the impact across key functions:
- Financial Performance Management: Imagine a Finance Manager who automatically receives consolidated reports prepared by the IBM Controller, reviewed with AI-assisted insights from Cognos Analytics, and validated against dynamic budget forecasts from Planning Analytics.
- Intelligent HR Operations: A People Leader uses Watsonx Orchestrate to streamline repetitive HR tasks—from scheduling interviews and summarising resumes to ensuring records are instantly updated across all ERP systems.
At Octane Analytics, we specialise in designing and deploying these agentic AI ecosystems, ensuring automation amplifies human capability and drives measurable outcomes.
Why Choose Octane Analytics?
As an IBM Gold Partner, Octane Analytics offers deep, specialised expertise in integrating and optimising IBM’s entire performance management stack.
Our approach is centred not just on product deployment, but on measurable business outcomes: enhanced agility in planning, increased accuracy in forecasting, greater efficiency in reporting, and empowerment through automation.
Whether your immediate need is strategic financial consolidation or a full-scale enterprise performance management overhaul, our team provides the expertise to define the roadmap, deliver the integrated solution, and ensure a demonstrable Return on Investment (ROI).
The Future: A Connected, AI-Powered Enterprise
The future of enterprise performance hinges on connected intelligence—an environment where AI and analytics continuously learn, adapt, and act across all business functions.
Organisations that master this integrated, AI-first approach will not only achieve operational efficiency but also build unparalleled resilience and foresight in a rapidly changing global market. At Octane Analytics, we are committed to helping enterprises realise this future, one intelligent decision at a time.
Let’s Build the Intelligent Enterprise Together
If you are exploring how integrated AI, advanced analytics, and automation can significantly elevate your business performance, we invite you to connect with us. Our team can provide tailored, real-world use case demonstrations—from predictive planning to automated workflow execution—all powered by IBM’s market-leading technology.
📩 Reach out to Octane Analytics today to schedule a discovery session.
We are standing at the threshold of the most significant transformation in finance since the invention of the spreadsheet. Artificial Intelligence isn’t a future concept — it’s here — quietly rewriting how finance teams plan, decide, and perform.
And yet, despite the global AI boom, 95% of enterprise AI initiatives fail to deliver measurable impact. Not because the technology falls short, but because most organisations stop too soon. They automate tasks but never redesign the system.
At Octane Solutions, we’ve worked with over 100 finance teams across APAC — and we’ve seen what separates the few that scale from the many that stall. The secret is simple but profound: structure before scale.
From Industrial Revolution to Intelligent Finance


When electricity first arrived in the 19th century, factories did what seemed logical — they replaced gas lamps with electric bulbs. Workplaces became brighter and safer, but not smarter. The true revolution began when they redesigned entire production lines around electric motors, unleashing a new era of efficiency and innovation.
Finance today stands at a similar crossroads.
Chatbots, copilots, and summarisation apps are our lightbulbs — illuminating the potential of AI but not transforming how work gets done. The real breakthrough will come with Agentic AI — a new generation of intelligent systems that reason, coordinate, and act autonomously across the finance ecosystem.
Agentic AI doesn’t just automate; it orchestrates. It doesn’t replace people; it amplifies them. And for the CFO, that means the finance function can finally shift from explaining the past to predicting — and shaping — the future.
The CFO’s Challenge: Insight at the Speed of Business
CFOs today face a dual reality:
- The demand for immediacy: real-time forecasting, continuous scenario analysis, and rolling insights.
- The constraint of legacy: manual reconciliations, fragmented data, and static planning cycles.
Most finance teams have automated fragments of their process — but not the process itself. Reporting is faster, but not necessarily smarter. True transformation happens only when AI becomes part of the fabric of finance — not an add-on.
Below are 6 opportunities now emerging as AI evolves from simple LLMs to self-governing, multi-agent ecosystems:
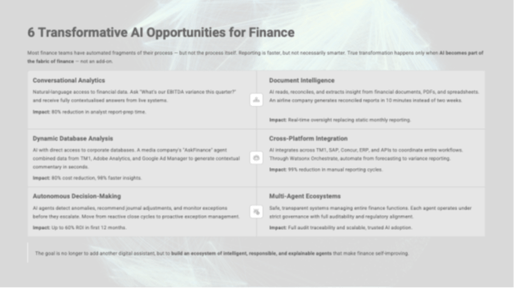
- Conversational analytics and natural-language access to financial data. Finance teams can now ask a question — “What’s our EBITDA variance this quarter?” — and receive a fully contextualised, narrative answer drawn from live systems.
By eliminating manual report preparation, CFOs gain faster clarity and sharper storytelling for stakeholders.
Impact: 80% reduction in analyst report-prep time and faster decision support across FP&A.
- AI that reads, reconciles, and extracts insight from financial documents, PDFs, and spreadsheets.
An airline company uses AI agents linked to Planning Analytics and Excel sources to generate reconciled financial reports in 10 minutes instead of two weeks.
Impact: Continuous visibility into financial performance, replacing static monthly reporting with real-time oversight.
- AI with direct access to corporate databases, enabling dynamic analysis. For a Media company, Octane’s “AskFinance” agent combined data from TM1, Adobe Analytics, and Google Ad Manager to generate contextual financial commentary in seconds.
Impact: 80% reduction in report-generation cost and 98% faster access to narrative insights — AI that doesn’t just calculate but explains why.
- AI that integrates across finance platforms — TM1, SAP, Concur, ERP, and APIs — to coordinate entire workflows. Through Watsonx Orchestrate, CFOs can now automate the entire chain from forecasting to variance reporting: “Generate a cashflow forecast and alert me if OPEX exceeds budget by 5%.” AI handles retrieval, validation, and communication autonomously.
Impact: 99% reduction in manual reporting cycles; faster consolidation, real-time alerts, and seamless cross-system collaboration. - Autonomous decision-making within governed boundaries. AI agents now detect anomalies, recommend journal adjustments, and monitor exceptions before they escalate. This allows finance functions to move from reactive close cycles to proactive exception management.
Impact: Predictive close cycles, risk reduction, and up to 60% ROI in the first 12 months of deployment.
- Safe, transparent, multi-agent ecosystems that manage entire finance functions. Each agent — whether a “forecast bot,” “audit bot,” or “reporting bot” — operates under strict governance, with auditability, explainability, and regulatory alignment. Octane’s enterprise rollout playbook embeds SOC2, GDPR, and financial reporting controls into every workflow.
Impact: Full audit traceability, regulator-ready documentation, and scalable, trusted AI adoption.
The CFO’s now need to realise that their goal is no longer to add another digital assistant, but to build an ecosystem of intelligent, responsible, and explainable agents that make finance self-improving. This shift isn’t about hype or replacing people. It’s about constructing a resilient, data-driven finance engine that learns, adapts, and optimises continuously — from planning to forecasting to audit.
Agentic AI marks the true turning point of the finance— moving beyond automation to orchestration, where decisions are made faster, risks are mitigated earlier, and value is created intelligently.
The 9 Principles Behind Successful AI Transformation
Through 100+ modernisation projects, Octane has distilled nine practices that consistently deliver value:
1. Align AI to Business Impact – Focus on measurable outcomes, not pilots.
2. Build a Finance AI Centre of Excellence – Unite Finance, IT, and Operations under a single vision.
3. Invest in Skills, Not Just Software – Equip people to interpret, question, and guide AI.
4. Adopt Adaptive Governance – Control risk without stifling innovation.
5. Prioritise Data Quality – No AI can outperform bad data.
6. Start with Use Cases – Identify problems before choosing platforms.
7. Automate the Mundane – Free people for creative and strategic work.
8. Measure by Business Outcomes – Look beyond cost savings to agility, accuracy, and trust.
9. Scale Proven Success – Replicate what works across divisions.
Transformation begins with clarity, not complexity.The Foundation of Trust and Scale: IBM
AI’s potential means nothing without trust. That’s why Octane’s partnership with IBM is central to every finance transformation journey.
Built on IBM’s Agentic AI Platform this foundation ensures that CFOs can modernise with confidence — embedding explainability, governance, and measurable ROI from day one. IBM’s Watsonx Orchestrate (Agentic AI Platform) is a key enabler. It uses intelligent digital workers to automate complex workflows, from reconciliations to board-pack creation. With embedded governance, it’s designed to keep humans in control while machines handle the heavy lifting.
Explore: IBM Watsonx Orchestrate →
Agentic AI: From Automation to Orchestration
IBM’s Agentic AI Frameworks mark a shift from tools to systems — from automating tasks to orchestrating end-to-end business outcomes.
They include:
-
Agent Development Lifecycle (ADLC): The governance backbone for building responsible agents.
-
Model Context Protocol (MCP): A transparent standard for open, explainable AI.
-
Hybrid-First Architecture: Ensures flexibility across cloud, on-prem, and edge.
This architecture doesn’t just make AI smarter — it makes it sustainable.
Learn more: Agentic AI Frameworks →
Anthropic + IBM: Responsible AI for Regulated Finance
IBM’s partnership with Anthropic brings the Claude family of models into the Watsonx ecosystem — marrying safety and sophistication.
This enables CFOs to deploy AI assistants that:
- Generate narrative financial reports in natural language.
- Automate forecasting and scenario modelling.
- Support reconciliations and anomaly detection within governed environments.
It’s AI that works like a trusted analyst — intelligent, auditable, and always under your control.
Read more: IBM–Anthropic Partnership →
Groq + IBM: Redefining Speed and Efficiency
AI adoption often stalls on cost and latency. Groq changes that.
By integrating Groq’s high-speed LPU architecture into Watsonx Orchestrate, IBM delivers 5× faster inference and 80% lower compute cost — without compromising security.
This is the infrastructure that turns AI pilots into production systems.
Octane + IBM: The Partnership That Delivers
Octane’s partnership with IBM isn’t symbolic — it’s operational. Our IBM Champions work hand-in-hand with IBM’s product and engineering teams to co-create real-world use cases for finance.
From FP&A to supply chain modelling, Octane helps clients deploy AI-ready cubes, design agentic workflows, and establish continuous improvement frameworks that evolve with business needs.
Our Global support models — Octane Black and Octane Blue — offer CFOs flexible, SLA-backed coverage that reduces total cost of ownership by up to 35%.
AI success isn’t about pilots — it’s about discipline, design, and delivery.
summary, The Cognitive Finance Function- The finance team of the future will not just report performance — it will anticipate, optimise, and advise.
It will be:
- Predictive, not reactive.
- Autonomous, not manual.
- Augmented, not overloaded.
- Connected, not siloed.
- Trusted, not opaque.
This is The Cognitive Finance Function — powered by AI, governed by design, and aligned with enterprise strategy.
What Next?
AI in finance isn’t about technology — it’s about transformation. The winners will be those who move beyond experiments to execution, designing their finance operations for intelligence, not just automation. As we head towards 2026, it's vital that your finance strategic plans are set and able to be easily communicated for impact.
Octane and IBM are helping CFOs make that leap — securely, measurably, and fast.
Book a strategy session with Octane to explore your AI-in-Finance roadmap and we’ll walk you through the below practical Roadmap to Building an Intelligent Finance Function

Sign up for a 30-day free

Diagnose — Identify Where AI Can Create Meaningful Impact
Design — Combine Orchestration with Human Judgment
Deploy — Start Small, Prove Fast, Scale Wisely
Demonstrate — Quantify ROI and Institutionalise Learnings
Differentiate — Make Finance the Intelligent Core of the Enterprise
Final Thought: From Lightbulb to Lighthouse
The future of finance belongs to leaders who don’t just turn on AI — they design for it. CFOs who embed intelligence, governance, and agility into their finance DNA will redefine how value is created and measured
Gone days, where we had no control/alerts mechanism on the TM1 database, CPU/memory it consumes, react at the nick of the moment before TM1 server crashes.
I am sure all TM1 lovers, administrators and business users who had these experiences in the past would connect to what I am referring to. For all new Planning Analytics users, in earlier versions of TM1/ Planning Analytics, we had little overview on how much on RAM/ memory can a TM1 instance use/utilize or have an inbuilt alter mechanism.
TM1 Database Alert Mechanism:
Issue:
Most of you know, TM1 Server loves memory/RAM, more memory available the better performance/processing you get. Due to the trade-off between the cost and memory availability, there has always been a cap on upper limit on RAM available to TM1 Server.
What is new:
We now have an inbuilt mechanism in Planning Analytics Workspace, wherein we can set certain configuration and look for alters at a different level.
Administrators can now set, database threshold and alter configurations in a single tab on the Database settings page for the individual database in Planning Analytics Administration.
Isn’t that the good news! To use this, Planning Analytics Workspace version must be 2.0.46 or higher. In the previous version of Planning Analytics Administration, it was not possible to apply unique settings for each database, thresholds and alerts were set on separate tabs of a configuration page, but settings were applied to all databases in the environment.
Navigation:
For database settings, go to the Administration page, click Database as shown below.
Click on settings (highlighted), Database Setting, move to Thresholds and alerts.
The administrator can enter values for Warning threshold and Critical threshold and enable alert as different resource usages, as shown below.
The administrator can also set thread auto-refresh time interval.
Wonderful, now you can implement these in your environment, any doubts – we are here to help you for sure! Contact us today to find out how we can help you leverage your data for true business intelligence.
You may also like reading “ Predictive & Prescriptive-Analytics ” , “ Business-intelligence vs Business-Analytics ” ,“ What is IBM Planning Analytics Local ” , “IBM TM1 10.2 vs IBM Planning Analytics”, “Little known TM1 Feature - Ad hoc Consolidations”, “IBM PA Workspace Installation & Benefits for Windows 2016”.
Octane Software Solutions Pty Ltd is an IBM Registered Business Partner specialising in Corporate Performance Management and Business Intelligence. We provide our clients with advice on best practices and help scale up applications to optimise their return on investment. Our key services include Consulting, Delivery, Support and Training. Octane has its head office in Sydney, Australia as well as offices in Canberra, Bangalore, Gurgaon, Mumbai, and Hyderabad.

IBM Planning Analytics (TM1) vs Anaplan
There has been a lot of chatter lately around IBM Planning Analytics (powered by TM1) vs Anaplan. Anaplan is a relatively new player in the market and has recently listed on NYSE. Reported Revenue in 2019 of USD 240.6M (interestingly also reported an operating loss of USD 128.3M). Compared to IBM which has a 2018 revenue of USD 79.5 Billion (there is no clear information on how much of this was from the Analytics area) with a net profit of 8.7 b). The size of global Enterprise Performance Management (EPM) is around 3.9 Billion and expected to grow to 6.0Billion by 2022. The size of spreadsheet based processes is a whopping 60 Billion (Source: IDC)
Anaplan has been borne out of the old Adaytum Planning application that was acquired by Cognos and Cognos was acquired by IBM in 2007. Anaplan also spent 176M on Sales and Marketing so most people in the industry would have heard of it or come across some form of its marketing. (Source: Anaplan.com)
I’ve decided to have a closer look at some of the crucial features and functionalities and assess how it really stacks up.
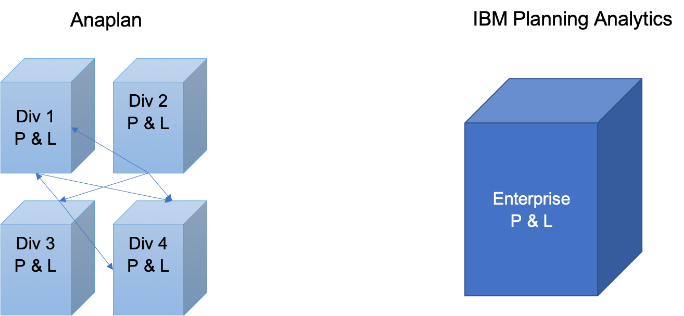
ScalabilityThere are some issues around scaling up the Anaplan cubes where large datasets are under consideration (8 billion cell limit? While this sounds big, most of our clients reach this scale fairly quickly with medium complexity). With IBM Planning Analytics (TM1) there is no need to break up a cube into smaller cubes to meet data limits. Also, there is no demand to combine dimensions to a single dimension. Cubes are generally developed with business requirements in mind and not system limitations. Thereby offering superior degrees of freedom to business analyst.
For example, if enterprise wide reporting was the requirement, then the cubes may be need to be broken via a logical dimension like region of divisions. This in turn would make consolidated reporting laborious, making data slicing and dicing difficult, almost impossible.
Excel Interface & Integration
Love it or hate it – Excel is the tool of choice for most analyst and finance professionals. I reckon it is unwise to offer a BI tool in today’s world without a proper excel integration. I find Planning Analytics (TM1) users love the ability to use excel interface to slice and dice, drill up and down hierarchies and drill to data source. The ability to create interactive excel reports with ability to have cell by cell control of data and formatting is a sure-shot deal clincher.
On the other hand, on exploration realized Anaplan offers very limited Excel support.


Analysis & Reporting
In today’s world users have come to expect drag and drop analysis. Ability to drill down, build and analyze alternate view of the hierarchy etc “real-time”. However, if each of this query requires data to be moved around cubes and/or requires building separate cubes then it’s counterproductive. This would also increase the maintenance and data storage overheads. You also lose sight of single source of truth as your start developing multiple cubes with same data just stored in different form. This is the case with Anaplan due to the software’s intrinsic limitations.
Anaplan also requires users to invest on separate reporting layer as it lacks native reporting, dashboards and data visualizations.
This in turn results in,
- Increase Cost
- Increase Risk
- Increase Complexity
- Limited planning due to data limitations
IBM Planning Analytics, on the contrary offers out of the box ability to view & analyze all your product attributes and the ability to slice and dice via any of the attributes.
It also comes with a rich reporting, dashboard and data visualization layer called Workspace. Planning Analytics Workspace delivers a self-service web authoring to all users. Through the Planning Analytics Workspace interface, authors have access to many visual options designed to help improve financial input templates and reports. Planning Analytics Workspace benefits include:
- Free-form canvas dashboard design
- Data entry and analysis efficiency and convenience features
- Capability to combine cube views, web sheets, text, images, videos, and charts
- Synchronised navigation for guiding consumers through an analytical story
- Browser and mobile operation
- Capability to export to PowerPoint or PDF
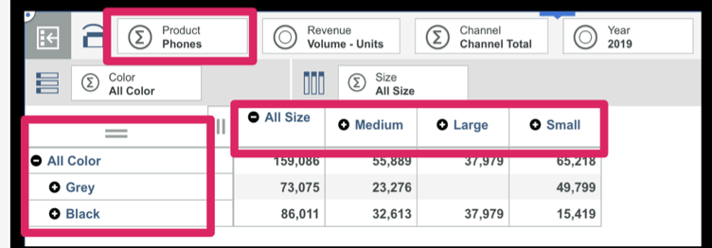
Source : Planning Analytics (TM1) cube
.jpg?width=512&name=unnamed%20(1).jpg)
This article talks about Business Intelligence and Business Analytics, things in common and about differences between one another. This blog also talks about the paybacks for an organization once these are adopted.
Let’s start ... Though Business Intelligence and Business Analytics sound similar and are being used interchangeably by many, they do have differences.
Business Intelligence ( BI ) :-
Term Business Intelligence, though exist for long, have been used by wider audience from late 90s .
Intelligence with in Business comes from the data being captured. Business Intelligence has been considered as a process to collect, store, maintain, retrieve and interpret data and purpose is to optimize, streamline and smoothen current operations within the Organization. BI helps in making better-informed decisions, improve performance, helps in creating new strategic opportunities for growth, eventually helps to better understand how the business is doing, make better-informed decisions.
In bullet points, BI is:
- A process deals with collecting data, querying, reporting, online analytical processing and alerting.
- The purpose of business intelligence is to support data-driven business decision making.
- BI solutions collect and analyse current and historical, actionable data with the purpose of providing insights into improving business operations.
- Improves and maintains operational efficiency and helps companies increase organizational productivity.
- BI is more concerned with the WHATs and the HOWs(Performance).
- BI Technologies are efficient enough to give insight on what happened in the past / is happening right now in business –If input data to BI systems is real and granular, Organisations would have a much better insight.
- BI refers to set of technologies(DSS) supporting decision-making process by executives, middle management.
- A dashboard gives all required insight needed, also displays data trend – thus helps management in taking right decision at right time to run the businesses effectively.
- BI tools have evolved to become much more intuitive and user-friendly.
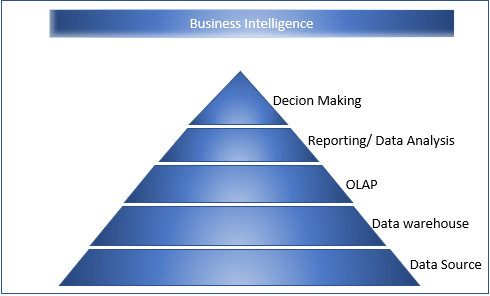
Business Intelligence gives information about the data itself and also provides insights rather than making extra transformations or conversions.
Business Analytics :-
Word, Business Analytics was also in existence for long but became a buzz word in last 10-15 years. Business Analytics is process of exploring data and interpreting data.
- Uses Statistical analysis and predictive modelling
- Business Analytics involves multiple technologies to transforming raw form of data into a meaningful way to convey the solution in best way possible.
- Analyses past data to drive current business and predict future business. Supports management in decision making to change existing business operations and improve productivity.
- Helps management in improving future business operations using current and history data, thus boosting future performance.
- Uses past data to extract insight, drive customer needs and increasing productivity.
- Establishes trends and helps analyse WHY things are happening and provide optimized solutions to solve problem.
- Applies to companies where future growth and productivity is one of their goal.
- Helps in answering WHAT and WHY and also HOW to achieve.
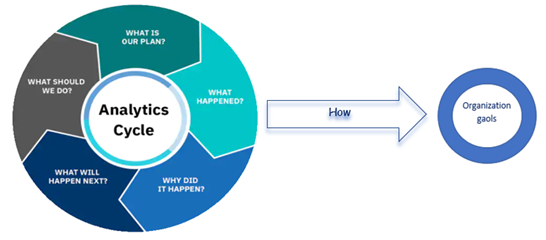
Business Intelligence and Business Analytics:-
Mutual:
- Collects raw data, current and historical data. Transforms raw data into meaningful data.
- Analyses data, helps in identifying pain points, provides alternatives, suggests optimized solutions.
- Data mining helps in finding insights from existing data .
- Rich visualization provides Dashboards.
- Dashboards can be a single point to know how Organization is performing, Areas to focus, historical data visualization and many more.
- Multiple technologies involved.
Focus:
- Business Intelligence focuses on past and current data, Business Analytics also uses past and current data but helps in predicting future trend using existing data.
- Business Intelligence Visualization helps with past and present trend to some extent predict future for the Business Model.
- Business Intelligence uses traditional approach, Business Analytics uses Statistical methods and models.
- Business Analytics though have reporting capability but primarily makes predictions using collected data and offers optimized solutions.
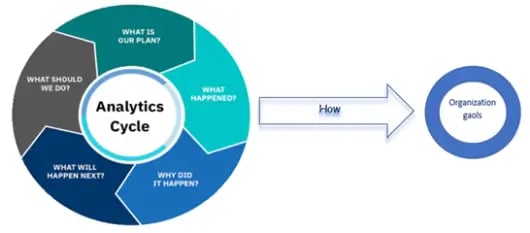
- Business Intelligence focuses on Descriptive and Diagnostic Analytics, Business Analytics is more about Predictive Analytics and Prescriptive Analytics.
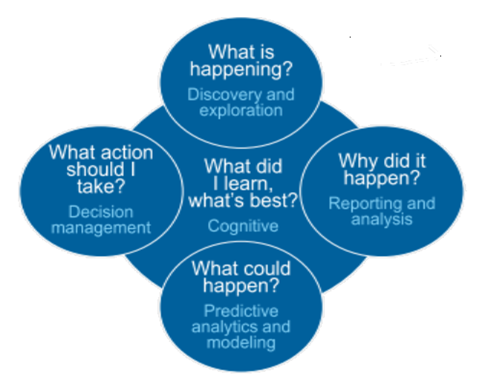
Both Business Intelligence and Business Analytics share activities with in above figure.
Organizational Benefits:
Business Intelligence and Business Analytics helps organization in meeting their Strategic Goals , near-term , long-term goals. These systems provide insights from raw data feed initially to a digestible and understandable information to the Executive management.
Business Intelligence helps giving insight with in Business Models, Analytics focuses on Business process and gives optimized solutions and thus helps decision making.
These systems provide details on business performance, help them answer many questions, some listed below.
- How business is performing.
- Current state
- When compared to last year, last quarter, last five years etc .
- Where is it performing well?
- Where is it not performing well?
- What happened?
- Why is it not performing well ?
- Why not ?
- What happened?
- What now?
- Are we missing Goals, what/How and who, what change needed etc
- What needs to be done ?
- What should change ?
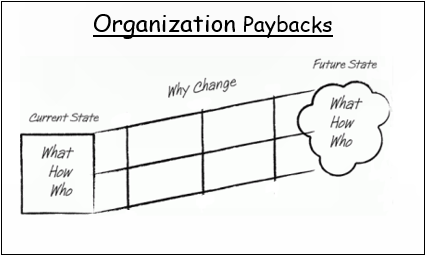
Business Users like, Executive Team, Middle management, Business Analyst can always do ad hoc analysis, ad hoc reporting and predict the impact of change to expected outcomes. Thus, helps management in taking decisions to meet Organizational objects, goals and targets.
Hope you would have enjoyed reading this blog as much as I had testing this cool feature; stay tuned for upcoming blogs.
You may also like reading “ What is IBM Planning Analytics Local ” , “IBM TM1 10.2 vs IBM Planning Analytics”, “Little known TM1 Feature - Ad hoc Consolidations”, “IBM PA Workspace Installation & Benefits for Windows 2016”.
For more Information: To check on your existing Planning Analytics (TM1) entitlements and understand how to upgrade to Planning Analytics Workspace (PAW) reach out to us at info@octanesolutions.com.au for further assistance.
Octane Software Solutions Pty Ltd is an IBM Registered Business Partner specialising in Corporate Performance Management and Business Intelligence. We provide our clients advice on best practices and help scale up applications to optimise their return on investment. Our key services include Consulting, Delivery, Support and Training.
Octane has its head office in Sydney, Australia as well as offices in Canberra, Bangalore, Gurgaon, Mumbai, and Hyderabad.
To know more about us visit, OctaneSoftwareSolutions.


Forward-thinking enterprises are using business intelligence and analytics to navigate through their digital transformation – one that could see them expand both physically and fiscally at a rapid pace.
The ability to harness this data and use it to make business decisions, however, poses challenges. This is particularly true for organisations that haven’t previously had the technology nor the manpower to sift through all the historical data they’ve accumulated in their daily activities.
Think about it – by 2020 it’s predicted there will be 5,200GB of data for every individual on the planet. More importantly, 90% of our current data is ‘unstructured’, drawn from mediums like social media and Internet of Things (IoT) devices.
Harnessing the power of business intelligence and analytics
So how can enterprises take advantage of data analytics? It starts with the three ‘I’s:
- Investment: Collecting and analysing your company data for future activities. You might be surprised what sort of data can be used for predictive modelling purposes to forecast future trends and outcomes.
- Innovation: Harnessing unexplored or raw data to see if your business can create new products or services.
- Improvisation: Parsing business data to find new meaning in it. This can lead to actionable insights that feed into the analytics cycle.

Using data to generate value
More and more businesses are recognising the usefulness of their data, but there’s still a way to go. While more than 80% see AI as a strategic opportunity, most aren’t using data to its full advantage.
These organisations may be using AI to reduce their operational costs or modernise their systems for better business intelligence and data warehousing, but to derive the very best value from your data, you need to be an insights-driven and transformative company.
What is the analytics cycle?
This all feeds into the analytics cycle, of which there is no one-size-fits-all design. IBM, for example, defines the cycle as taking a Planning, Descriptive, Diagnostic, Predictive and Prescriptive approach.
But the bottom line is that every business’s analytics cycle should feed into one central goal: gaining a competitive advantage.
Your cycle might start with identifying a business problem, preparing and analysing the data, A/B testing different solutions and then monitoring the results.
And that model will likely change according to the data you are analysing or the business problem you need to solve. So long as the target is building a more sustainable and competitive business, you’ll be able to use your business intelligence and analytics to generate greater value for your company.
Are you looking to harness the power of data and rise above the competition? Contact Octane Software Solutions today to find out how we can help you derive real business value from your data.

we go the extra mile so you can go the distance|
Got a question? Shoot!
Lorem ipsum dolor sit amet, consectetur adipiscing elit, sed do eiusmod tempor incididunt ut labore et dolore magna aliqua.
.png)
.png)





.png?width=673&height=371&name=IBM_Gold-removebg-preview%20(1).png)
Leave a comment