Loss vs Gain? As we know – one thing that is constant is change and in the technology the change is always for the advancement from current and improvising the existing features. IBM has made significant changes to its Financial Performance Management product and has rebranded TM1 to IBM Planning Analytics. Rebranding TM1 to Planning Analytics does not mean you are going to lose existing tools ...
- IBM TM1 10.2 vs IBM Planning Analytics
- The new age of analytics: How IBM SPSS is powering responsible AI in 2025
- Unveiling Dynamic Lists in IBM Planning Analytics for Excel
- ChatGPT for Enterprise: Reimagine how works gets done with AI powered automation
- Is it time to move to Planning Analytics on the Cloud?
- Manage Your KPIs with Business Intelligence Applications
Loss vs Gain?

As we know – one thing that is constant is change and in the technology the change is always for the advancement from current and improvising the existing features.
IBM has made significant changes to its Financial Performance Management product and has rebranded TM1 to IBM Planning Analytics.
Rebranding TM1 to Planning Analytics does not mean you are going to lose existing tools like Architect, TM1Web, Perspective, Performance modular, Insight etc. IBM has enhanced the existing tools and improvised them. Few among many are listed below.
- The Cognos TM1 Web UX is totally redesigned and Web sheets can load, scroll and refresh faster than ever before.
- TI Process debugger: Turbo Integrator processes designers have some good news, quality breakpoints and variable analysis has been enabled.
What’s new in Planning Analytics:
- IBM Planning Analytics Workspace
- Planning Analytics for Excel (PAx)
- Planning Analytics – Hierarchies
Let’s focus on each one from the above bullets.
IBM Planning Analytics Workspace (PAW)
New face of the IBM Cognos TM1/Planning Analytics solution. The interface is a highly visual, freeform design with over 25 charts, scorecards, images, shapes and many other options.
- Data rich tool, can show data from all different cubes, to meet business needs.
- Support Analysis, Reporting and Write-back features.
- Highly interactive viewer, easy to swap data exploration to charts.
- Workspace is mobile and can be accessed from tabs/ iPads.
- Flexible enough to export to excel and publish same to workspace.
- And many more features.
I am sure, once you feel it you would love it.
Introduction to Planning Analytics for Excel (PAx)
- Formerly known as CAFÉ, PAx has overcome many issues in CAFÉ.
- Supports TM1 functions-based reports, Active Forms and Flex Views.
- Ability to publish reports to TM1 Web and Workspace.
- Support for new Hierarchies features in Planning Analytics.
- As per IBM, PAx has adopted more than 80% features within Perspective.
- Mostly driven by REST API, thus supporting WAN. This mitigates network related and other issues in Perspective. Superior performance over wide-area networks. No Citrix needed.
Introduction to Planning Analytics – Hierarchies.
- “Hierarchies” capability is a paradigm-changing analysis feature.
- Explore data using “attributes” that describe many characteristics of our customers, products, projects, programs, financial instruments and more.
- Leveraging attribute data in the form of ” virtual dimensions”.
- Out of the traditional Box - With the Hierarchies capability, you’re not limited to the traditional definition of your cubes for analysis.
- Users can see the intersections of several Hierarchies of the same dimension.
- Use Hierarchies for dimension re-organizations and versioning. This means one can evaluate the re-organization impact before it happens, with few mouse clicks.
TM1 Server
Some among many other features are listed below.
- TM1 Databases can load 2-4X times faster with Multi-Threaded cube loading.
- Rule Files compile 2-4x times faster with Multi-Threaded feeder processing.
TM1 Web
TM1 Web has been overhauled with a new refreshed interface and very similar to that of Planning Analytics Workspace. Some among many are listed below.
- Completely new User Experience Design.
- Faster Websheet Loading, recalculation, and Scrolling.
- Additional Conditional Formatting - Colour scale and Icon set.
- Active X control support.
- iPad Support.
What happens if upgrade is delayed ?
- One will be left far behind in this constantly changing Technology world, where embracing new technology is considered as “must”.
- Cannot use the additional features and thus cannot reap benefits.
- IBM has made official support end date for Cognos TM1 10.2.0 and 10.2.2 and has advised Clients to migrate to Planning Analytics at the earliest.
Upgrade made easy:
- We are experts in this Cognos TM1 technology, having extensive experience in upgrading TM1 from older versions to newer Versions.
- Migrated our client’s system from TM1 9x and 10x versions to new trending technology called IBM Planning Analytics.
- Installed Planning Analytics Workspace and integrated with Planning Analytics.
- Planning Analytics is one of the reasons for making IBM to be in Leaders quadrant.

You may also like following blog “ What is IBM Planning Analytics Local ”
Who we are ?
Octane Software Solutions is an IBM partner specialising in Business Intelligence. We provide our clients advice on best practices in Business Intelligence and scaling up applications to optimise your return on investment.
The key services we provide to our clientele are Consulting, Delivery, Support and Training.
For more details you can click on OctaneSoftwareSolutions.
Try out our TM1 $99 training
Join our TM1 training session from the comfort of your home
In a world where AI is becoming smarter and faster, one constant challenge remains: trust.
We all want better forecasts, more accurate models, and faster insights. But as we scale machine learning and predictive analytics across the enterprise, a critical question emerges, Can we explain the results?
That’s where IBM SPSS is quietly making a big impact in 2025.
Why SPSS is still a game-changer
You might think of SPSS as a tool for academic stats or survey analysis. However, its transformation in recent years positions it as a core enabler of responsible AI in businesses and government.
.png?width=499&height=286&name=Agentic%20AI%20blog%20(1).png)
With capabilities like:
-
Automated machine learning (AutoML) in SPSS Modeller,
-
Bias detection and explainability tools,
-
Seamless integration with Python and open-source libraries,
SPSS offers something that most modern AI platforms don’t: transparency without complexity.
Responsible AI isn't just a Buzzword
In industries like finance, healthcare, and the public sector, it’s not enough for a model to be accurate; it needs to be explainable, auditable, and compliant.
SPSS’s visual interface and guided modelling help non-programmers build powerful models with confidence, while its ability to export models as Python code or PMML supports enterprise deployment at scale.
It bridges the gap between business users, data scientists, and compliance teams, a rare feat in today’s fractured AI tool ecosystem.
What’s hot in SPSS right now?
-
AutoAI + SPSS Modeler
IBM’s AutoAI capabilities are now extending into SPSS workflows. Users can automatically select the best algorithms, tune hyperparameters, and test pipelines, without writing a single line of code. -
Ethical Forecasting in the Public Sector
Government agencies are using SPSS to model outcomes for policy changes, ensuring algorithms are fair and decisions are backed by explainable data. -
Citizen Data Science
SPSS is a leading tool in the “citizen data scientist” movement, empowering finance teams, marketing analysts, and HR professionals to run predictive models without relying solely on IT.
A quick real-life use case
A large healthcare provider recently used SPSS Modeler to predict patient readmission risks. The team was able to build, test, and deploy a model within weeks, with complete traceability and audit logs to satisfy HIPAA and internal governance requirements.
Looking Ahead: The Future of SPSS in AI
The buzz in 2025 is all about hybrid AI, the blending of traditional statistical models with generative AI and LLMs. SPSS, with its deep roots in statistics and newer integrations with Watson and Python, is perfectly positioned to lead this evolution.
Whether you're an analyst, a data science leader, or a decision-maker exploring AI, don’t sleep on SPSS. It’s more relevant than ever.
💡 Are you still thinking of SPSS as “just” a stats tool? Let’s talk. I’d love to hear how you're applying predictive analytics in your organisation, or explore where SPSS could fit into your journey to responsible AI.
In this blog post, I aim to demonstrate a simple yet effective technique to display the members returned by a set as a list in Excel. This serves as a quick and efficient method for analysing the results from your static or MDX-based sets.
.gif?width=559&height=320&name=TM1%20newsletter%20(1).gif)
This approach offers an alternative to using the TM1ELLIST function in Planning Analytics for Excel (PAfE), which also returns an array of members based on MDX expression or a set. However, the TM1ELLIST function requires the user to manually enter the formula to view the results and it does not support hierarchies.
When you add a SUBNM or TM1Set function in PAfE, you may have an automatic addition of data validation to the cell, allowing for selection from a dropdown list.
Upon navigating to the Data Validation option in Excel, you will discover a hidden named range called “cafe_validation_temp” added under the “Source” field.
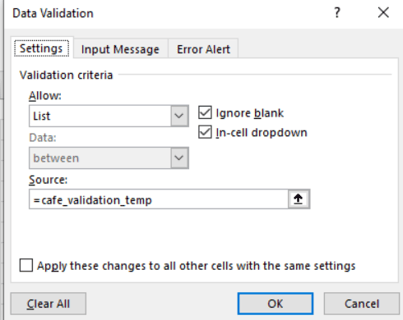
This is a generic named range that is applied to all cells containing SUBNM and TM1SET functions.
The key to this technique is to reference the “cafe_validation_temp” named range in a cell that triggers automatic display of members as a spilled list in Dynamic Array compatible excel worksheets.
Doing so will automatically display the members of the active cell that contains SUBNM or TM1SET functions. As you select a different cell containing these functions, the list will automatically update to show the members returned from those functions.
Furthermore, as TM1SET is hierarchy-aware, it seamlessly returns results from hierarchies, enhancing the flexibility and depth of analysis.
For training and support please feel free to email media@octanesolutions.com.au
In the realm of digital transformation, the concept of digital labor has emerged as a game-changer for businesses seeking efficiency, agility, and innovation. IBM WatsonsX Orchestrate, a powerhouse in the AI and data orchestration space, takes center stage in this digital evolution. This blog explores the pivotal role played by WatsonsX Orchestrate in reshaping digital labor and how it empowers organizations to harness the full potential of artificial intelligence (AI) and data science.
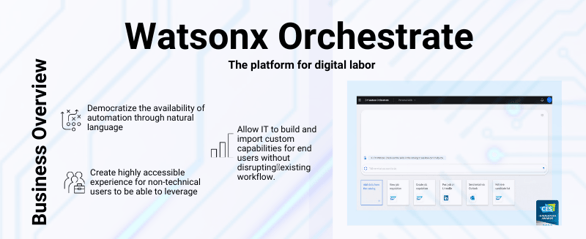
Orchestrate allows you to add and train new automations from a variety of sources, enabling users to easily work across existing systems using a single UI.
.png?width=567&height=302&name=fiji%20blog%20(1).png)
Understanding Digital Labor:
Digital labor refers to the use of digital technologies, including AI, automation, and robotics, to augment or replace human tasks and processes. It's a paradigm shift in how work is done, leveraging technology to enhance productivity, reduce errors, and enable humans to focus on more strategic and creative aspects of their roles.

"Companies that effectively apply intelligent automation across the enterprise expect to outshine peers in profitability, revenue growth, and efficiency over the next 3 years."
IBM WatsonsX Orchestrate and Digital Labor:
-
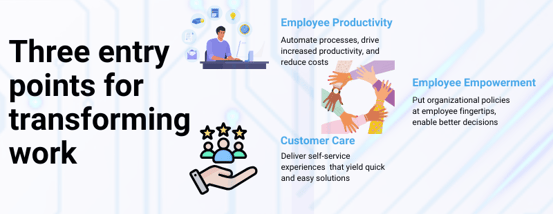
Workflow Automation for Operational Efficiency: One of the key pillars of digital labor is workflow automation, and WatsonsX Orchestrate excels in this domain. By automating intricate AI and data science workflows, the platform significantly reduces manual effort, streamlining processes and enhancing operational efficiency. This allows organizations to accomplish more with less, freeing up human resources for high-value tasks.
-
Collaboration for Enhanced Productivity: Digital labor is not about replacing human workers but augmenting their capabilities. WatsonsX Orchestrate fosters collaboration among cross-functional teams, bringing together data scientists, developers, and domain experts. This collaborative environment accelerates problem-solving, decision-making, and innovation, creating a synergistic relationship between digital labor and human expertise.
-
Scalability to Meet Growing Demands: As organizations scale their digital labor initiatives, scalability becomes a critical factor. WatsonsX Orchestrate provides the flexibility to scale horizontally and vertically, ensuring that the platform can seamlessly adapt to the growing demands of AI and data science projects. This scalability is essential for organizations aiming to expand their digital labor capabilities without compromising performance.
-
Model Monitoring and Management for Continuous Improvement: In the era of digital labor, continuous improvement is paramount. WatsonsX Orchestrate includes robust tools for monitoring and managing AI models in production. This ensures that digital labor processes based on AI models deliver consistent and reliable results over time. The platform's capabilities contribute to the iterative refinement of digital labor processes, optimizing outcomes and enhancing overall performance.
-
AI Explainability and Ethical Digital Labor: Transparent digital labor practices are crucial for building trust and ensuring ethical use of AI. WatsonsX Orchestrate provides tools for explaining AI model decisions, addressing the interpretability challenge often associated with complex AI systems. Additionally, the platform includes features for detecting biases, aligning digital labor practices with ethical standards and promoting fairness in decision-making.

There are more than 2,000 activities that make up 800 full-time occupations that are part of knowledge work. However, only 5% of these full-time occupations could be fully automated using existing technology. That means that the 95% of remaining occupations require cognitive abilities.
Benefits for Businesses:
-
Accelerated Time-to-Value: By automating and streamlining AI and data science workflows, organizations can significantly reduce the time it takes to move from ideation to deployment, ultimately accelerating their time-to-value for AI initiatives.
-
Improved Collaboration: The collaborative features of WatsonsX Orchestrate facilitate better communication and knowledge sharing among teams, leading to more effective and impactful AI solutions.
-
Enhanced Governance and Compliance: The platform provides robust governance and compliance features, ensuring that organizations can meet regulatory requirements and maintain a high standard of data ethics.
-
Cost-Efficiency: With the ability to scale and the flexibility of deployment options, WatsonsX Orchestrate helps organizations optimize costs by aligning infrastructure with project requirements.
In the era of AI and data-driven decision-making, IBM WatsonsX Orchestrate stands out as a powerful solution for organizations looking to harness the full potential of their AI and data science initiatives. With its automation capabilities, collaborative environment, and emphasis on ethical AI, WatsonsX Orchestrate is poised to become a key player in the journey towards building intelligent, transparent, and scalable AI solutions. As businesses continue to navigate the complexities of the digital age, platforms like WatsonsX Orchestrate provide the tools needed to turn data into a strategic asset and drive innovation in the ever-evolving landscape of AI.
In today's digital age, businesses are constantly seeking ways to optimize their data management processes. One solution that has gained significant popularity is the migration of planning analytics to the cloud. This strategic move offers several advantages that businesses can leverage to enhance their data management capabilities.
.png?width=426&height=323&name=social%20post%20(1440%20%C3%97%201080%20px).png)
Why Cloud?
One of the primary reasons why companies are making the switch to cloud-based planning analytics is the instant global presence it provides. By storing data in data centers located around the world, organizations can ensure that their data is accessible to users whenever and wherever it's needed.
Cost Considerations
-
Server Costs – Hardware, Software, and Administration
-
Storage Costs – Hardware and Administration
-
Network Costs – Hardware and Administration
-
IT Labor Costs – Server and Virtualization Administration
-
Overhead Costs – Space, Power, Cooling
-
Application Costs – Software maintenance, Administration
Business Considerations
-
Faster Go-To market – Ever-changing and ever-evolving business conditions
-
Scalability – Up & Down
-
Flexibility – address seasonality, tests, short term demands
-
Focus – On business and core competence rather than IT.
This not only reduces latency but also enables quick decision-making, especially in time-sensitive situations. Additionally, having a global presence opens up new revenue streams as companies can cater to customers from all over the world.
Another key benefit of migrating planning analytics to the cloud is the high performance and reliability it offers. Cloud infrastructure can be tailored to meet the specific needs of users, ensuring optimal performance and improved security.
While multi-tenant cloud environments are commonly available, opting for single-tenant cloud environments can further enhance performance and security.
The instant deployment capability of cloud services is also a major advantage for businesses. Cloud providers offer pre-configured services, minimizing the setup time required. This allows organizations to provision services immediately upon order, enabling them to build powerful applications and deliver them securely via web, mobile, or desktop.
The agility of cloud-based deployment also eliminates the need for complex IT infrastructures and support, streamlining the overall process.
Migrate
.png?width=504&height=284&name=social%20post%20(3).png)
Scalability is another crucial factor driving the migration of planning analytics to the cloud. Businesses need a platform that can easily scale as they grow. Cloud customers can add more users, storage, and features as their requirements evolve.
This flexibility enables companies to pay for only what they need, avoiding unnecessary expenses on software and hardware. Moreover, cloud users can scale up temporarily when there is a spike in usage and then scale back down, further optimizing costs.
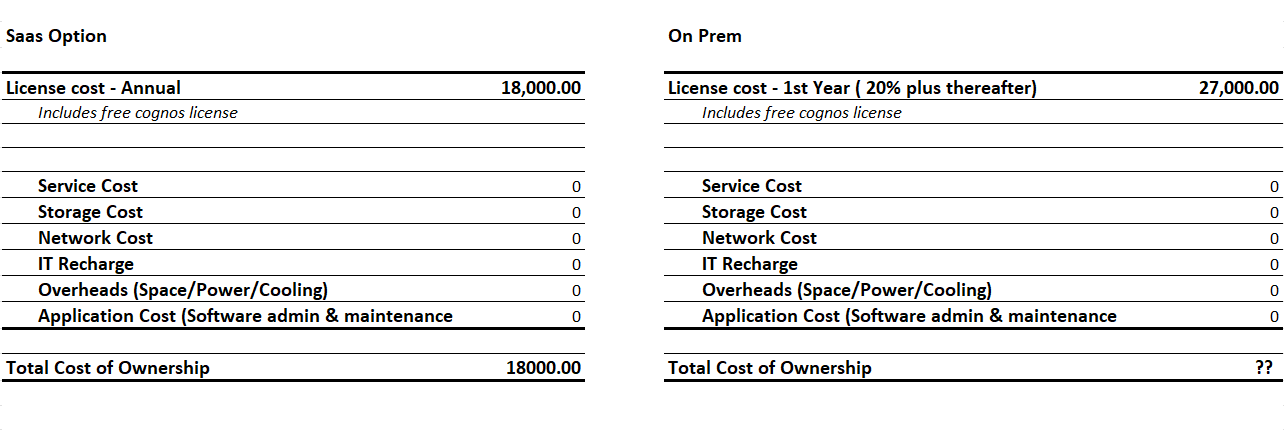
Disclaimer: The pricing may vary. This is only an example of how the computation will look on the actual
Security is a top concern for all businesses, and the cloud offers robust security features to address this. Cloud providers stay up-to-date with industry standards and compliance certifications to ensure data security. Single-tenant cloud environments provide an additional layer of security, with only one point of access and no risk of data being combined or accessed by unauthorized users. This level of security minimizes the chances of data breaches, which could have severe consequences for any organization.
Pitfalls – Be Aware! Key Considerations
-
All clouds are not equal – evaluate Public, Private, Hybrid, and associated unique strengths.
-
All-in in one go – Determine applications best suited for migration, associated risks, and timelines.
-
Don’t leave Om-Premise behind – It’s key to tune your on-premise applications for cloud utilization.
-
Hands-of Outsourcing – While it’s on the cloud, lacking in-house expertise can cost dearly and result in project failures.
-
Keep a Scorecard – evaluate all workload's economic, security, and risk profiles. Keep a tab.
-
Move beyond lift & shift – using the cloud shouldn’t only be about cheap hardware and storage.
One of the most compelling reasons to migrate planning analytics to the cloud is the cost savings it offers. By eliminating capital expenses for infrastructure, such as servers and storage, businesses can save significant amounts of money. Maintenance and upgrades associated with physical storage are also eliminated, freeing up resources for other strategic initiatives. With the pay-as-you-go model, companies only pay for the storage and features that are actively used, ensuring cost optimization.
Run
.png?width=520&height=293&name=social%20post%20(4).png)
In conclusion, migrating planning analytics to the cloud provides businesses with a range of benefits, including global accessibility, high performance, instant deployment, scalability, enhanced security, and cost savings. This strategic move equips organizations with the agility and capabilities required to thrive in today's digital landscape.
By embracing the cloud, businesses can not only meet the changing demands of employees for mobile working and remote access but also gain a competitive edge over their peers who rely on legacy on-premises storage solutions.
Octane Fixed Price Upgrade – A$19,950
Be in the cloud in 14 days
Get IBM Planning Analytics (TM1) and its associated applications Workspace and the Microsoft Excel interface on the cloud.
We perform a like-for-like migration of data from TM1 perspectives to TM1 cloud including integration of data sources and setting up licenses and user access. We include 4 hours of user training to ensure users can play and use TM1 properly. Book a free discovery call
|
Like for like migration Unlimited Cubes Unlimited dimensions Unlimited Hierarchies |
20 Excel reports Up to 2 TM1 Instances Up to 3 environments Use propriety Octane checklist |

With a variety of business intelligence applications at your disposal, it’s worth investigating the best and comparing your needs against each product to get the best return on your investment.
Here are three ‘must-haves’.
1. Customisable workspace
With a business intelligence application like IBM Planning Analytics, you can enjoy a single and consistent environment in which to manage your KPIs.
So whether you need to measure business performance, evaluate and alter plans, expose gaps or test-drive the impact of potential scenarios on your business activity, you can do so in an interactive, customisable workspace.
2. Predictive analytics
Combining the predictive capabilities of IBM Watson Analytics as well as self-service data discovery, IBM Planning Analytics is a business intelligence tool that injects your performance management with the exceptional capabilities of cognitive computing.

Its natural-language interface makes searches and queries easy, with fast data discovery a given. A range of time-consuming functions are automated – such as data preparation, refinement, management and analysis – so you can focus on what’s most important while always trusting that the data provided is reliable.
3. The capacity to harness both internal and external datasets
Do you have a variety of co-workers who need to leverage insights derived from both internal and external sources on a daily basis – business analysts, line-of-business managers, financial analysts and more?
Then you’ll want a solution that allows users to access business intelligence sources and enterprise resource planning programs to derive valuable information relevant to their ongoing needs. IBM Planning Analytics puts that very information in front of the people who need it most, helping them make faster, smarter decisions that are business critical.
Finding the best business intelligence applications
No matter what industry you’re in, ‘planning’ should be the beating heart of your organisation. And when compliance and consistency are essential to the ongoing success of your operations, you need a business intelligence application that doesn’t compromise on your need for solid analytics functionality.
To learn more about how IBM Planning Analytics could be the business intelligence application for you, contact Octane Software Solutions today.

Despite the rampant growth of new data, constantly evolving technologies and the digitalisation of entire sectors, there are a few facets of business that will never be eliminated entirely: volatility, uncertainty and risk.
But with business intelligence tools, you can keep your organisation on the right track and reduce the inherent risks of day-to-day operations. Here’s how.
A complete, all-in-one business tool
When seeking out a business intelligence tool to adopt in your organisation, you’ll want one with speed, agility and flexibility, so it provides a return on your investment.
With IBM Planning Analytics, for example, you get all those things and more, leading to an all-in-one performance management solution that can be deployed either on-site or in the cloud for operational security.
In addition to its user-friendly and intuitive framework, it provides insights to help both large and small businesses drive greater process efficiency. This is essential in a fast-paced and competitive industry, where the process of analysing data quickly is vital in order to expedite decision-making and take business-critical actions.

The keys to exceptional business intelligence tools
There are plenty of business intelligence tools on the market, but not all are created equal. In order to derive the most value from your tool, you’ll want to ensure it offers:
- Speed and flexibility: You’ll want a tool that allows you to hit the ground running while also leaving room for you to build out your deployment as and when needed.
- Agility: Your business intelligence tool needs to adapt to your changing needs so it can accommodate all your budgets, plans and forecasts even as business conditions fluctuate.
- Foresight: The ability to visualise insights from both internal and external datasets. You can leverage those insights to anticipate future trends and drive your business growth.
Benefits from installing the right tool
Whether you’re a chief data officer, innovation executive or simply a jack-of-all-trades in your organisation, you need to conduct your due diligence when sourcing an appropriate business intelligence tool.
Choose IBM Planning Analytics, for example, and you’ll find it works at an inter-departmental level to streamline time-consuming activities like creating plans, budgets and forecasts in a customisable analytics environment.
Business leaders can engage with fast and flexible ‘what if’ scenario modelling to assist them in important decision-making. And perhaps most important for the wider business team, natural-language searching allows even the most inexperienced users to perform searches and make queries for powerful analysis.
To learn more about how a business intelligence tool like IBM Planning Analytics can take your enterprise to the next level, contact Octane Software Solutions today.


The right business intelligence software can help companies beat out the competition and become market leaders in their industry.
We reveal how to leverage three key benefits of business intelligence software - and overcome some potential drawbacks!
1. Integration across disparate business systems
In order to derive the best strategic insights, you typically need to analyse data from across a number of different systems. Your company’s operational results, for example, require a financial perspective. That means your business intelligence solution should be able to integrate data from various sources to generate answers to your business questions.
2. Historical analysis and reporting
Successful decision-making relies on a comprehensive understanding of how your company has grown in recent years and the reasons behind that growth. Your business intelligence solution must be able to both map and analyse historical data from years in the past. Ensure you choose a tool that can extract, manipulate and parse large amounts of data – in many enterprises, millions of database entries are standard fare.

3. Predictive capabilities
Your solution’s ability to analyse and report historical data means you’ll be able to harness current opportunities, while also predicting your company’s future steps. This power of forecasting should always remain top-of-mind when striving for success.
Overcoming potential challenges
So what about the potential drawbacks? There are a couple of cons to consider, but with the right knowledge you can overcome them to truly realise the power of your business intelligence software.
- A difficult learning curve can hamper take-up. For non-technical employees, business intelligence solutions can be challenging to adopt. If this is the case in your company, choose software with a user-friendly interface that is easy to learn and use on a day-to-day basis. Further, invest in business intelligence training so you can be comfortable your employees will be able to use the tool and deliver the expected returns.
- Unnecessary features. Some vendors will try to entice you with gimmicky, useless features, and in most cases you’ll never end up using them. The best solution is one that understands the functionality you require while eliminating any features you don’t need.
Interested in leveraging the strength of business intelligence software in your enterprise? Contact Octane Software Solutions to find out how we can help.

Picking the right business intelligence tools for your organisation is essential in the current era of big data. With information coming from all angles, it’s imperative to leverage the best software to make sense of your data and parse it into actionable, meaningful decision-making.
-1.webp?width=499&height=336&name=business-intelligence-tools-Dec-26-2022-10-02-06-5%20(1)-1.webp)
Why do you need business intelligence tools?
In their most basic form, business intelligence tools allow you to ‘see’ your data. This means you can watch how your data creates patterns and correlations. That information – including statistics and current trends – can then be used to formulate plans for the future.
In essence, the right business intelligence tools can be harnessed for their predictive capabilities as much as for their capacity to centralise your data.
Choosing the right tool for your organisation
Not all tools are created equal, so it’s crucial that you conduct your due diligence before investing in a long-term solution.
Here are a few basic questions to help ensure you get software that aligns with your data needs:
- Will the solution be able to integrate with your current system?
- Is the interface intuitive and easy to interact with?
- Does the tool come with user-friendly drop-down menus, search functionalities, filters, etc.?
- Who will use the tool? Experienced data analysts or everyday business users? Will the tool offer real-time value from complex data across these skill sets?
- Does it allow access across multiple devices?
- Does it have adequate security?
- Is it mobile-friendly?
Also, consider the level of functionality you require. There's ‘light’ software that offers basic operations like data visualisation and querying, or solutions that double as a chief data analyst.
IBM's TM1, for example, offers in-depth functionality. Powered by IBM Planning Analytics, this streamlined analysis tool can parse essential data to create financial plans, budgets and forecasts. It also reviews ‘what if’ scenarios so you can test whether certain courses of action are business-appropriate.
Interested in learning more? No matter your requirements, contact our team to discuss the right tool to take your organisation to the next level.

In our hyper-connected business world, organisations are often siloed and sometimes spread across multiple locations. Combine that with the fact that the majority of employees are ‘hooked in’ to company-wide systems via their smart devices, and you have a raft of users able to access data and alter it.
The problem? This often creates version-control issues that not only impact productivity and the effectiveness of your business intelligence (BI), but can harm your reputation and profitability.
What is a ‘single version of the truth’?
When discussing ‘truths’ in the form of BI, it’s important to clarify the difference between a ‘version’ of the truth and a ‘source’ of the truth.
A single source of truth refers to “a data storage principle to always source a particular piece of information from one place”. The single version of the truth is the operating data that an entire company agrees is the real and trusted information.
The issue with fragmented data
There are two crucial factors when considering any type of business data: quality and governance. Without one or the other, it’s impossible to derive accurate metrics from any BI. But because siloing in business remains such a rampant issue – across all markets and sectors – there’s an ongoing risk that this will create ‘competing’ versions of the truth.
For companies that have multiple versions of the truth, there exists the danger of contradictory answers pulled from the same data. And when ‘multiple truths’ really means ‘no truths at all’, that’s a lose-lose for all parties.
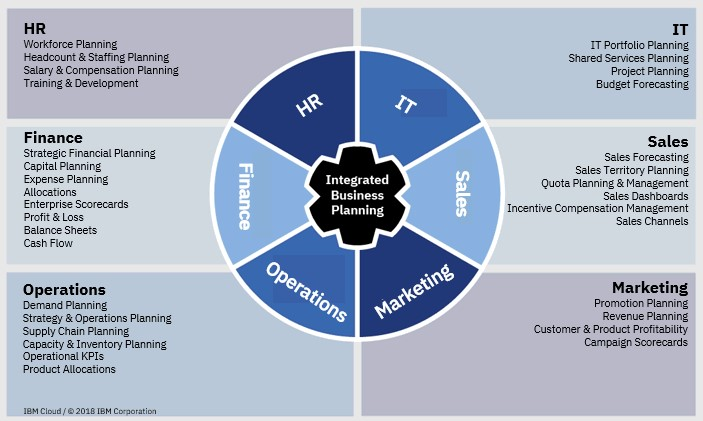
Integrated Planning using single version of the truth
IBM Planning Analytics is your ideal application to facilitate integrated planning. It is not a point solution for each planning requirement. The data and drivers utilised in reporting and planning processes are consistent across the enterprise. Coupled with a sleek Workspace Dashboard and a excel interface it appeals to both an analytical user base and general report consumers.
Is your organisation guilty of spending a large amount of time reconciling multiple versions of truth or worse making decisions based on flawed data being presented?
Would a centralised business intelligence solution help you take advantage of your data? Contact Octane today to find out how we can help.

.jpg?width=512&name=unnamed%20(1).jpg)
This article talks about Business Intelligence and Business Analytics, things in common and about differences between one another. This blog also talks about the paybacks for an organization once these are adopted.
Let’s start ... Though Business Intelligence and Business Analytics sound similar and are being used interchangeably by many, they do have differences.
Business Intelligence ( BI ) :-
Term Business Intelligence, though exist for long, have been used by wider audience from late 90s .
Intelligence with in Business comes from the data being captured. Business Intelligence has been considered as a process to collect, store, maintain, retrieve and interpret data and purpose is to optimize, streamline and smoothen current operations within the Organization. BI helps in making better-informed decisions, improve performance, helps in creating new strategic opportunities for growth, eventually helps to better understand how the business is doing, make better-informed decisions.
In bullet points, BI is:
- A process deals with collecting data, querying, reporting, online analytical processing and alerting.
- The purpose of business intelligence is to support data-driven business decision making.
- BI solutions collect and analyse current and historical, actionable data with the purpose of providing insights into improving business operations.
- Improves and maintains operational efficiency and helps companies increase organizational productivity.
- BI is more concerned with the WHATs and the HOWs(Performance).
- BI Technologies are efficient enough to give insight on what happened in the past / is happening right now in business –If input data to BI systems is real and granular, Organisations would have a much better insight.
- BI refers to set of technologies(DSS) supporting decision-making process by executives, middle management.
- A dashboard gives all required insight needed, also displays data trend – thus helps management in taking right decision at right time to run the businesses effectively.
- BI tools have evolved to become much more intuitive and user-friendly.
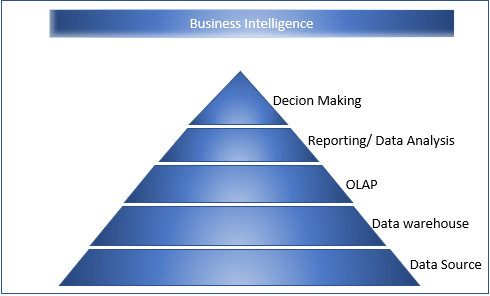
Business Intelligence gives information about the data itself and also provides insights rather than making extra transformations or conversions.
Business Analytics :-
Word, Business Analytics was also in existence for long but became a buzz word in last 10-15 years. Business Analytics is process of exploring data and interpreting data.
- Uses Statistical analysis and predictive modelling
- Business Analytics involves multiple technologies to transforming raw form of data into a meaningful way to convey the solution in best way possible.
- Analyses past data to drive current business and predict future business. Supports management in decision making to change existing business operations and improve productivity.
- Helps management in improving future business operations using current and history data, thus boosting future performance.
- Uses past data to extract insight, drive customer needs and increasing productivity.
- Establishes trends and helps analyse WHY things are happening and provide optimized solutions to solve problem.
- Applies to companies where future growth and productivity is one of their goal.
- Helps in answering WHAT and WHY and also HOW to achieve.
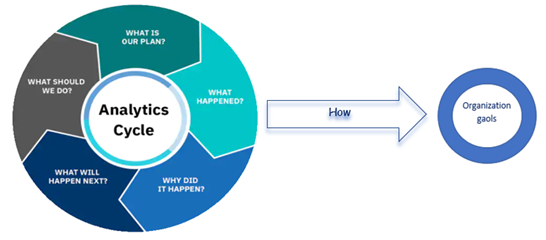
Business Intelligence and Business Analytics:-
Mutual:
- Collects raw data, current and historical data. Transforms raw data into meaningful data.
- Analyses data, helps in identifying pain points, provides alternatives, suggests optimized solutions.
- Data mining helps in finding insights from existing data .
- Rich visualization provides Dashboards.
- Dashboards can be a single point to know how Organization is performing, Areas to focus, historical data visualization and many more.
- Multiple technologies involved.
Focus:
- Business Intelligence focuses on past and current data, Business Analytics also uses past and current data but helps in predicting future trend using existing data.
- Business Intelligence Visualization helps with past and present trend to some extent predict future for the Business Model.
- Business Intelligence uses traditional approach, Business Analytics uses Statistical methods and models.
- Business Analytics though have reporting capability but primarily makes predictions using collected data and offers optimized solutions.
- Business Intelligence focuses on Descriptive and Diagnostic Analytics, Business Analytics is more about Predictive Analytics and Prescriptive Analytics.
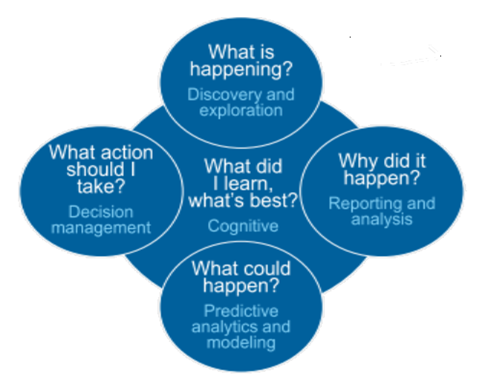
Both Business Intelligence and Business Analytics share activities with in above figure.
Organizational Benefits:
Business Intelligence and Business Analytics helps organization in meeting their Strategic Goals , near-term , long-term goals. These systems provide insights from raw data feed initially to a digestible and understandable information to the Executive management.
Business Intelligence helps giving insight with in Business Models, Analytics focuses on Business process and gives optimized solutions and thus helps decision making.
These systems provide details on business performance, help them answer many questions, some listed below.
- How business is performing.
- Current state
- When compared to last year, last quarter, last five years etc .
- Where is it performing well?
- Where is it not performing well?
- What happened?
- Why is it not performing well ?
- Why not ?
- What happened?
- What now?
- Are we missing Goals, what/How and who, what change needed etc
- What needs to be done ?
- What should change ?
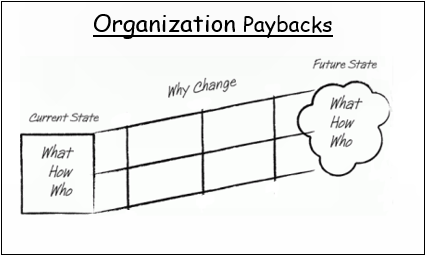
Business Users like, Executive Team, Middle management, Business Analyst can always do ad hoc analysis, ad hoc reporting and predict the impact of change to expected outcomes. Thus, helps management in taking decisions to meet Organizational objects, goals and targets.
Hope you would have enjoyed reading this blog as much as I had testing this cool feature; stay tuned for upcoming blogs.
You may also like reading “ What is IBM Planning Analytics Local ” , “IBM TM1 10.2 vs IBM Planning Analytics”, “Little known TM1 Feature - Ad hoc Consolidations”, “IBM PA Workspace Installation & Benefits for Windows 2016”.
For more Information: To check on your existing Planning Analytics (TM1) entitlements and understand how to upgrade to Planning Analytics Workspace (PAW) reach out to us at info@octanesolutions.com.au for further assistance.
Octane Software Solutions Pty Ltd is an IBM Registered Business Partner specialising in Corporate Performance Management and Business Intelligence. We provide our clients advice on best practices and help scale up applications to optimise their return on investment. Our key services include Consulting, Delivery, Support and Training.
Octane has its head office in Sydney, Australia as well as offices in Canberra, Bangalore, Gurgaon, Mumbai, and Hyderabad.
To know more about us visit, OctaneSoftwareSolutions.

There’s no question that more and more enterprises are employing analytics tools to help in their strategic business intelligence decisions. But there’s a problem - not all source data is of a high quality.
Poor-quality data likely can’t be validated and labelled, and more importantly, organisations can’t derive any actionable, reliable insights from it.
So how can you be confident your source data is not only accurate, but able to inform your business intelligence decisions? It starts with high-quality software.
Finding the right software for business intelligence
There are numerous business intelligence services on the market, but many enterprises are finding value in IBM solutions.
IBM’s TM1 couches the power of an enterprise database in the familiar environment of an Excel-style spreadsheet. This means adoption is quick and easy, while still offering you budgeting, forecasting and financial-planning tools with complete control.
Beyond the TM1, IBM Planning Analytics takes business intelligence to the next level. The Software-as-a-Service solution gives you the power of a self-service model, while delivering data governance and reporting you can trust. It’s a robust cloud solution that is both agile while offering foresight through predictive analytics powered by IBM’s Watson.

Data is only one part of the equation
But it takes more than just the data itself to make the right decisions. The data should help you make smarter decisions faster, while your business intelligence solution should make analysing the data easier.
So how do you ensure top-notch data? Consider these elements of quality data:
- Completeness: Missing data values aren’t uncommon in most organisations’ systems, but you can’t have a high-quality database where the business-critical information is missing.
- Standard format: Is there a consistent structure across the data – e.g. dates in a standard format – so the information can be shared and understood?
- Accuracy: The data must be free of typos and decimal-point errors, be up to date, and be accurate to the expected ‘real-world’ values.
- Timeliness: Is the data ready whenever it’s needed? Any delays can have major repercussions for decision-making.
- Consistent: Data that’s recorded across various systems should be identical. Inconsistent datasets – for example, a customer flagged as inactive in one system but active in another – degrades the quality of information.
- Integrity: Is all the data connected and valid? If connections are broken, for example if there’s sales data but no customer attached to it, then that raises the risk of duplicating data because related records are unable to be linked.
Are you looking to harness the power of your source data to make actionable business decisions? Contact Octane to find out how we can help you leverage your data for true business intelligence.


Forward-thinking enterprises are using business intelligence and analytics to navigate through their digital transformation – one that could see them expand both physically and fiscally at a rapid pace.
The ability to harness this data and use it to make business decisions, however, poses challenges. This is particularly true for organisations that haven’t previously had the technology nor the manpower to sift through all the historical data they’ve accumulated in their daily activities.
Think about it – by 2020 it’s predicted there will be 5,200GB of data for every individual on the planet. More importantly, 90% of our current data is ‘unstructured’, drawn from mediums like social media and Internet of Things (IoT) devices.
Harnessing the power of business intelligence and analytics
So how can enterprises take advantage of data analytics? It starts with the three ‘I’s:
- Investment: Collecting and analysing your company data for future activities. You might be surprised what sort of data can be used for predictive modelling purposes to forecast future trends and outcomes.
- Innovation: Harnessing unexplored or raw data to see if your business can create new products or services.
- Improvisation: Parsing business data to find new meaning in it. This can lead to actionable insights that feed into the analytics cycle.

Using data to generate value
More and more businesses are recognising the usefulness of their data, but there’s still a way to go. While more than 80% see AI as a strategic opportunity, most aren’t using data to its full advantage.
These organisations may be using AI to reduce their operational costs or modernise their systems for better business intelligence and data warehousing, but to derive the very best value from your data, you need to be an insights-driven and transformative company.
What is the analytics cycle?
This all feeds into the analytics cycle, of which there is no one-size-fits-all design. IBM, for example, defines the cycle as taking a Planning, Descriptive, Diagnostic, Predictive and Prescriptive approach.
But the bottom line is that every business’s analytics cycle should feed into one central goal: gaining a competitive advantage.
Your cycle might start with identifying a business problem, preparing and analysing the data, A/B testing different solutions and then monitoring the results.
And that model will likely change according to the data you are analysing or the business problem you need to solve. So long as the target is building a more sustainable and competitive business, you’ll be able to use your business intelligence and analytics to generate greater value for your company.
Are you looking to harness the power of data and rise above the competition? Contact Octane Software Solutions today to find out how we can help you derive real business value from your data.

Business trip to Australia…
the prospect itself is enough to make a dead man stand up and dance. More so as Swetha, Sasi & I were travelling to be in 2 of the worlds “best cities to live in. We visited Perth & Sydney; No..no 3 cities in fact, we transited via Melbourne airport. I know what you thinking, but it does count as we got to “check-in” Facebook... Haha, see SMART!!
Before I start, very important to note the itinerary we were on as it boosted our flaunt status back in India! Why ?? Well it had so many check points and an envious schedule which had us touching 4 countries & 6 cities in 17 days.
We flew from Bangalore -> Singapore -> Perth -> Sydney -> Melbourne -> Colombo -> Bangalore.
So here’s how it went…
Day 1 Travelling
We were flying from Bangalore to Perth via Singapore with a stopover of 9 hours between our connecting flights. Initially had decided to go for a Singapore trip which is provided by Changi airport facilities and services; we weren’t lucky enough to get that tour…so typical. We ended up roaming inside the airport which was way more fun than going out I believe...
 Some Intense Discussions

Movie Theatre

The Sunflowers and US
It’s said you can master anything that you practice and basically keep at it. Well at the end of our “airport trip” we were qualified enough to apply for Airport Information Desk job. Haha!! Jokes apart, Singapore airport had definitely lived-up to our expectations as the world’s number 1.
After all the drama and action (meant Movies) and good 9 hours, we boarded flight to Perth.
Day 2 at Perth, Australia
Had a late start to the day as we landed way early in the morning at 1AM (not sure why it’s called that, was rather very late in the night). We quickly headed to the nearest McDonalds to have our breakfast; why the choice? well we wanted to play safe with food. Last thing you want to do is experiment and call-in sick day 1. Sasi had a heart attack (almost) as there were no Veggie Burgers on the menu…Poor Sasi…
 Morning Selfie
First things first, made sure we understand the way to Western power office (Client location) …didn’t want no dramas on Monday. It was then the time to explore…Perth here we come


At Elizabeth Quay
Day 3 With Client
It’s Mon-Yay, work day. Usually associated with blues, this Monday came in unusually bundled with pleasant surprises as we got ready to meet our clients; Not in a typical scrum but face to face.
Surprise no.1, Siang Lee (Client) had come to pick us up from hotel. Ingrid, our beloved client who was already excited that we were flying to Perth ensured we were escorted. Really… touched.

At the client site
Surprise no.2, Ingrid didn’t expect Swetha to be so petite and neither did Swetha, who was equally shocked to see how tall Ingrid was. What we witnessed was a totally new style of embrace, I call it the “Squat Hug”. Ingrid literally had to crouch to hug her sweetie, Swetha.
Surprise no.3, Dave, Ingrid’s manager who was very sweet came all the way to food court just to show us the Place. Good people around make a good day worth it…
Day 4 Imparting Training
Day started with Training Clients on TM1. Just to put in record, this was one of the real reasons why we were travelling. Day was spent well on team building and interaction with the clients.
Had Internal meetings to ensure our Demo which was due on Friday was is inline. This was the other big reason, had to showcase and make client understand the power of Planning Analytics Workspace (PAW), which by the way is TM1 reimagined (newer version of the software).
Day 5 Trainings Continued with a bit of fun
This was a mixed day full of work and fun. Post Advance TM1 training for the clients we went out for lunch to hay street and witnessed the London Court Clock.

London Court Clock
Evening was to be at the Cottesloe Beach to catch the Sunset. As always, Siang was too kind and drove us to the beach. It was Stunning

 Sunset
Siang then took us around the City; we drove to Varsity, Kings park (where we saw the amazing view of Perth City), Crown (a great place to hang out) and wrapped up the tour at Optus Stadium. Unreal


Fun in the city
Day 6 Knowledge Sharing
We had a good session with clients. It’s all about knowledge sharing.
One day to go for PAW demo; Swetha and Sasi worked hard on the presentation. Nick (our Octane Australia colleague) helped us build customer scenarios using PAW. After all it’s about presenting things in perspective.
Boss (Amendra) checked-in at Perth to boost our energy, to kill the Demo; felt like landing on an oasis in a desert after days of search. Hahaha!!
 The Customary Selfie
Day 7 Demo Day
The big day was here, everyone suited-up, prepared for the War. We had 25+ people in room attending the session and …. we nailed it!!



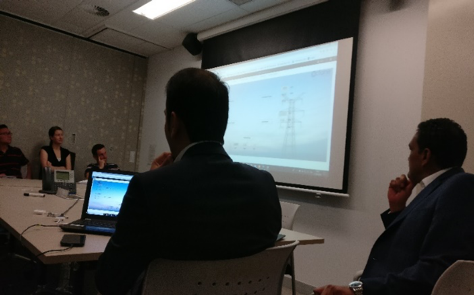
Work Work
We went to a Chinses restaurant (Yum cha) to celebrate our association and success. Good food and good people, some fun talk and some business. All in all, good afternoon indeed.

After bidding goodbye to the Western Power Staff. We headed to play mini golf in Holey Moley golf Club. Amazing game, lucky for few (That’s me)
![]()

Day 8 Goodbye Perth
Such warm people and amazing place to be. Will miss and remember Perth forever. Sydney…HERE WE COME
Hope you would have enjoyed reading this blog as much as I had experiencing this first hand
You may also like reading:
“ What is IBM Planning Analytics Local”
“IBM TM1 10.2 vs IBM Planning Analytics”
“All you need to know about Planning Analytics 2.0.5”
“Little known TM1 Feature - Ad hoc Consolidations”
“IBM PA Workspace Installation & Benefits for Windows 2016”
“TI Optimisation – An Epilogue”
To Subscribe, visit http://blog.octanesolutions.com.au
For more Information: To check on your existing Planning Analytics (TM1) entitlements and understand “how to”, reach out to us at info@octanesolutions.com.au
Octane Software Solutions is an IBM Registered Business Partner specialising in Corporate Performance Management and Business Intelligence. We provide our clients advice on best practices and help scale up applications to optimise their return on investment. Our key services include Consulting, Delivery, Support and Training.
Octane has its head office in Sydney, Australia as well as offices in Canberra, Bangalore, Gurgaon, Mumbai, and Hyderabad.
To know more about us visit, OctaneSoftwareSolutions.
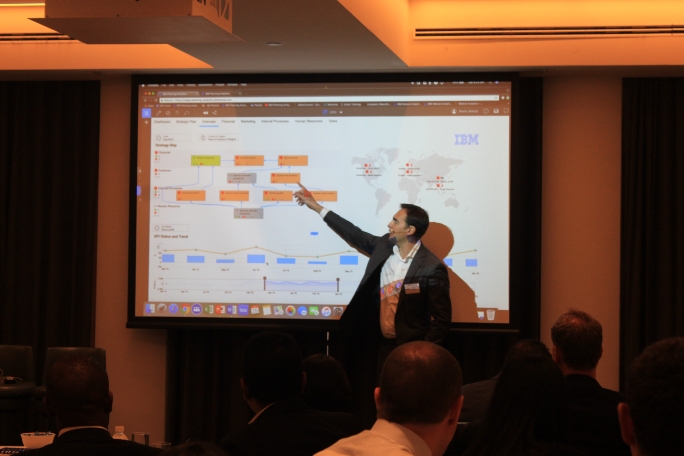
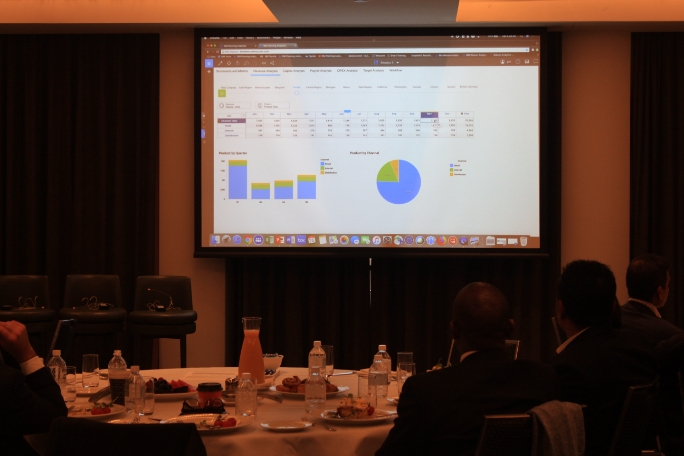
This Tuesday (25th Sep 2018) Octane Solutions proudly hosted a meeting for Senior Finance, IT Executives and Experts representing various companies and industries. The event was kicked-of by Mr. Amendra Pratap (MD, Octane Solutions) and Mr. Thomas Maddocks (ANZ Software Sales Leader - Commercial, IBM). This was followed by a solution demonstration conducted by Mr. Kevin Jessop (Lead FPM Solution Specialist, IBM) and a panel discussion.
Thank you to all who attended our Executive Breakfast event; We were pleasantly overwhelmed with the response and excitement in the room.
Redefining Planning and Analysis with an infusion of Visual, Cognitive, and Predictive analytics capabilities is now a reality.



CONCLUSION:
Octane and IBM Planning Analytics not only support essential performance management processes, but also go beyond basic automation to facilitate Collaboration, drive Business Insights and improve Decision Making throughout the enterprise.
Future is Here – help your organisation become more agile and well prepared.
Welcome back, for those who had read Part A of this blog, hope you would have tested Parallel Interaction and benefitted from it. For those who haven’t, you can read it at http://blog.octanesolutions.com.au/caveat-around-concurrent-data-loads-part-a
This blog builds upon the previous one and focusses on improving performance by Parallel Interaction, it highlights TM1 facets worth consideration while an object is locking.
Synopsys
Tips towards improvements around support for concurrent read/write and/or parallel execution of turbo integrator process enabling higher efficiencies and productivity.
Analysis
- Declare unique view and subset names
This allows to run a Turbo Integrator process without locking when executed by concurrent users simultaneously.
- Establish Cube Dependency
This nullifies the chance of a query or process triggering a cube dependency; this usually happens during periods of user activity that may block objects and cause contention issues for concurrent reads and writes.
To establish a cube dependency, include AddCubeDependency function and valid only in the Turbo Integrator process. This function creates a manual dependency between two cubes in the model.
Syntax: AddCubeDependency('CubeA','CubeB');
|
Argument |
Description |
|
CubeA |
The name of the base cube. |
|
CubeB |
The name of the dependent cube. |
Cube B relies on a rule that is dependent on Cube A.
- Use a ViewConstruct function in Turbo Integrator processes
This will increase the speed of Turbo Integrator process as it stores a stargate view in memory on the server. The purpose of ViewConstruct function is to cache the view by pre-calculating and storing large views for quick retrieval post a data load or update.
Syntax: ViewConstruct(CubeName, ViewName);
|
Argument |
Description |
|
CubeName |
The cube from which you want to construct the view. |
|
ViewName |
The view you want to construct. This view must be an existing public view on the server. |
- Dimension Maintenance (or Dimension read/write)
This places locks on read and write operations in any cube that includes dimension updates. Thrashing may result in locks during dimension maintenance (read/write to dimensions) as part of executing the Turbo Integrator process.
Note: Do not include dimension maintenance as part of data upload or updates.
- Maintaining an Attribute (Alias)
This again places locks on read and write in any cube that includes dimension updates.
Thrashing may result in locks during dimension maintenance (read/write to dimensions) as part of executing the Turbo Integrator process.
Note: Do not include attribute alias maintenance as part of data upload or updates.
For more Information: To check on your existing Planning Analytics (TM1) entitlements and understand “how to”, reach out to us at info@octanesolutions.com.au.
Octane Software Solutions Pty Ltd is an IBM Registered Business Partner specializing in Corporate Performance Management and Business Intelligence. We provide our clients advice on best practices and help scale up applications to optimise their return on investment. Our key services include Consulting, Delivery, Support and Training.
Octane has its head office in Sydney, Australia as well as offices in Canberra, Bangalore, Gurgaon, Mumbai, and Hyderabad.
Get a free one-hour consultation on us
To know more about us visit, OctaneSoftwareSolutions.
If you haven't seen already the latest version of Cognos Analytics is now available for you to download.
Luckily you won't need to read the about the latest changes. You can view this youtube clip which will explain what's new in it's reporting, dashboarding, stories and the portal for IBM Cognos Analytics 11.0.11.
If you don't have the time some advanced features include using custom polygons and points for mapping. Also included is data caching in dashboards and stories, as well as support for Portal Pages, and controlling object visibility.
To download the software you can find the corresponding install instructions in the link below.
Most who are still on Cognos Business Intelligence software version 10.2.x would know that the software version was due End of Service this April 2018. It was quite dreading for existing users who had not planned an upgrade to Cognos Analytics (or C11 as it is called within IBM) just yet as it wasn’t really a straight forward version upgrade but a complete overhaul in the way you would interact with Cognos BI; more intuitive, user friendly and insightful but requires a bit of learning and a little more unlearning.
GOOD NEWS!!
IBM has just announced a new support option – Continuing Support for all Cognos 10.2.x versions when your software reaches End of Service (EOS).
Things to note;
- Continuing Support provides flexibility for you to remain up and running on your software version with non-defect Support until you are able to upgrade to the latest version.
- Continuing Support provides uninterrupted access to many of the benefits of S&S and is more affordable than other options, such as a Service Extension or Total Content Ownership.
- Continuing Support is only available when you maintain active IBM SW S&S (Support and Subscription).
- Continuing Support assistance provides you with access to pre-existing and available fixes. New interim fixes will NOT be created as part of this offering.
- If a new interim fix is required, you will need first to purchase and sign a contract for a Service Extension. This is conditional and not a guarantee.
- A Service Extension is recommended only if you want to cover your mission critical installations.
- What if you have already purchased a Service Extension from IBM for non-mission critical application support? Well do not worry, IBM is allowing its customers to cancel an existing Service Extension agreement. By cancelling your Service Extension agreement, you will remove coverage for defect assistance and will be required to pay an increased fee if defect correction is required in future.
- IBM may withdraw or discontinue Continuing Support for the Programs by providing at least twelve (12) months’ prior notice of such withdrawal or discontinuance.
What does Continued Support “does not” include as compared to standard S&S;
- Voice and electronic access support for code-related problems.
- Development analysis of new defects.
- Development of or packaging fixes that are not already available.
- Support for Supporting Programs and third-party components.
- Infrastructure that are not included in the software version’s Hardware and Software Requirement page.
For more information;
- To check on your existing S&S contract and its extension you are encouraged to email on askcs@us.ibm.com or reach out to us at info@octanesolutions.com.au for further assistance.
- For clients who own Cognos 10.2.x software but are not currently under IBM S&S agreement, kindly reach out to us at info@octanesolutions.com.au and learn how you can get your software regularised to receive extended/continued support.
- To read about this announcement and more, visit https://www-01.ibm.com/support/docview.wss?uid=swg22005165
Octane Software Solutions Pty Ltd is an IBM Registered Business Partner specializing in Corporate Performance Management and Business Intelligence. We provide our clients advice on best practices and help scale up applications to optimise their return on investment. Our key services include Consulting, Delivery, Support and Training.
Octane has its head office in Sydney, Australia as well as offices in Canberra, Bangalore, Gurgaon, Mumbai, and Hyderabad.
To know more about us visit, OctaneSoftwareSolutions.In this blog, let me explain you about one of the hidden/unused feature from IBM Cognos TM1.
Before we start, let me ask you a question -
Have you ever come across below requirements or related issues while working with TM1?
- Urgent requirement - Management needs new consolidation within a Canned report to meet their business needs.
- An Ad hoc requirement from business to get new consolidation member at the earliest.
- An alternative roll-up request from the Boss - for a better analysis using existing data.
- Stakeholders request to have additional consolidations which may be part of ad hoc analysis.
- An analysis of a new Product Line and its business with additional consolidations rolling up, which is not present in the system.
- Analysis on what if some of my operating centers move out due to Organizational changes.
- Any other related scenarios.
– if yes then I am sure you will enhance your knowledge.
The Default (Existing) Method
In these scenarios the first choice has always been to create/edit a roll-up and this would need a change to existing system and the next choice would have been to use excel formulae to build report as per Stakeholder’s expectation – editing existing report
Let’s try understanding dependencies and complexities to perform this change: -
- If there are many source systems for TM1 and hierarchy is maintained at source, this change may have to be pushed to the following scheduled releases.
- In big organizations where Business changes are maintained by different Vendors (Service providers) this small change may have a bigger impact and thus becomes a challenge to quickly implement.
- If these changes are requested during critical month-end, Quarterly or during Year-End it will further get delayed.
- If it is an Excel report, Excel formulae can be used but when the template is too big then there is a high chance of human error and thus demands a lot of time and effort.
As we now understand that this request though looks simple, but in actual the default method takes more time/ effort to meet the need of the hour.
The Hidden TM1 Feature - Another Method!
Now that we understand the difficulty or constraints in making changes to dimension, let me take your through another option which has not been explored by many.
Here I would like to take you through another option, which can be used to meet the immediate need with little (or) less effort with below example.
Example: -
Here is a simple example and this logic can be applied to any dimension with any number of elements.
Considering Month as a dimension which has a simple and flat hierarchy as shown below.

Now there is a requirement from stakeholders to see the data at consolidations at half year [1st, 2nd] and at quarters[Q1-Q4] to have a better understanding of data quarterly and half yearly.
Created public subsets Q1, Q2, Q3, Q4 and H1, H2, as show below.
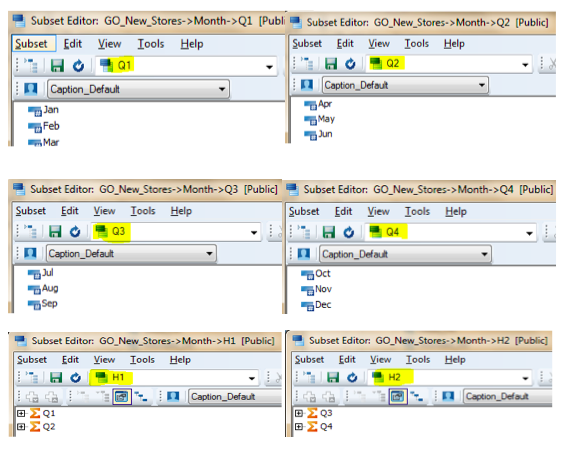
We now need to Insert these subsets into existing subsets “FY”.
Steps: -
- Open subset, here it is FY.
- Click on Edit and Insert Subset. You will get a new pop-up, select H2 and
- Click Ok.

Above mentioned steps were followed to get H1,Q1,Q2,H2,Q3 and Q4 into FY Subset and FY Subset will look like one below.

Let us now focus on how data looks while using these subsets.
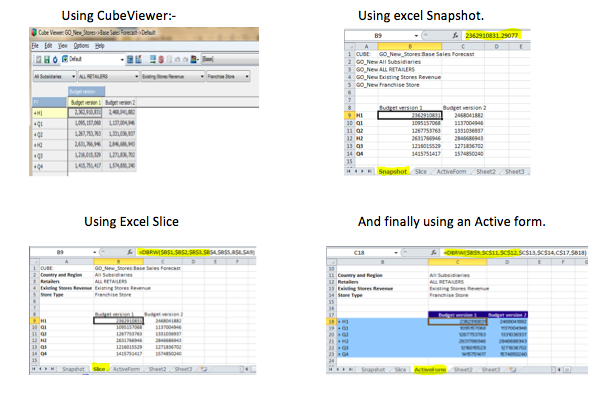
Who can perform this hidden TM1 method?
Above suggested changes can be done by TM1 Admin, DataAdmin, Power Users, Business Users or any TM1 user even if the user is not a power user. A non-power User can also use this feature through another option which I would discuss more in my coming blogs. Stay tuned.
A key note:
One must remember that TM1 is a wonderful platform to empower management and end-users for their business needs and help them arrive at better long term strategic decisions across various departments/ functions. The design, development and implementation must be of high standard as you aim to remove inefficiencies, create something that is easy to understand, maintainable and adaptive for future development needs.
***
You may also like reading blogs “ What is IBM Planning Analytics Local ” , “IBM TM1 10.2 vs IBM Planning Analytics”
Who are we?
· Octane Software Solutions is an IBM partner specialising in Business Intelligence.
· We provide our clients advice on best practices in Business Intelligence and scaling up applications to optimise your return on investment.
· The key services we provide to our clientele are Consulting, Delivery, Support and Training.
· For more details you can click here to find out more Octane Software Solutions.
One of the major challenges of promoting code to successive instances is packaging the code for promotion and finding a slot for downtime. Not to mention the sequence of steps required to carry out the procedures and to communicate to one and all about the impending downtime. Adding to this difficulty is finding downtime when users are accessing the application from across the globe.So irrespective of deployment size, either major or minor, the deployment process is never going to be easy. However you can potentially overcome this using one of the TM1 Suite tools.
To achieve this the following are prerequisites, TM1 Performance Modeler should be installed and source & target should be configured to access TM1 Performance Modeler.
Let’s take an example of moving “Region” dimension from “SData” to “Planning Sample” using TM1 Performance Modeler.
- Login to Performance Modeler and open up the “SData”
- Under “Model Design”, expand Dimensions and right click on region dimension and select Transfer Out

- It will pop up with path to be exported after providing the valid path, will open the transfer design screen

- Hit on Transfer button to export the region dimension.
- Copy the exported files to target machine and login to “Planning samples” in TM1 Performance Modeler
- Open the Transfer Design and click on “New Transfer Specification”
- In the Source section, click on the source type to select the source as “Files” , as seen in the image below

- Mention the path where the exported files are kept. It will display list of objects which are exported and select the object to be deployed to right side
- In the target section, click on the Target type to select the target as Model Element
- Hit on “Transfer” Button to deploy the objects.
- As you can see the changes are deployed, it's that simple believe it or not. Hopefully you'll find this trick nifty.

In this weeks blog, our team make it our duty to shine some light on right tool your company can choose to meet your business needs. We will cover the much discussed benefits of installing and using IBM's Planning Analytics workspace on Windows 2016.
Contents
What is PA and PAW?

Planning Analytics ("PA") is the next version, or can be considered as the next generation of TM1. IBM enhanced TM1 functionality and features and embraced new tools to its' suite. This new enhanced TM1 has been rebranded as PA. IBMs PA has the best of BI, Watson, planning and analytic engines under one solution.
IBM Cognos TM1 which required trendy data presentation and visualization capability – a demand from Clients - has now been fulfilled by IBM. IBM has embedded Workspace to Planning Analytics, which is now called Planning Analytics Workspace ("PAW"). The below diagram gives a high level picture of new Architecture.
The following diagram shows where PAW fits into your IBM PA Local architecture:
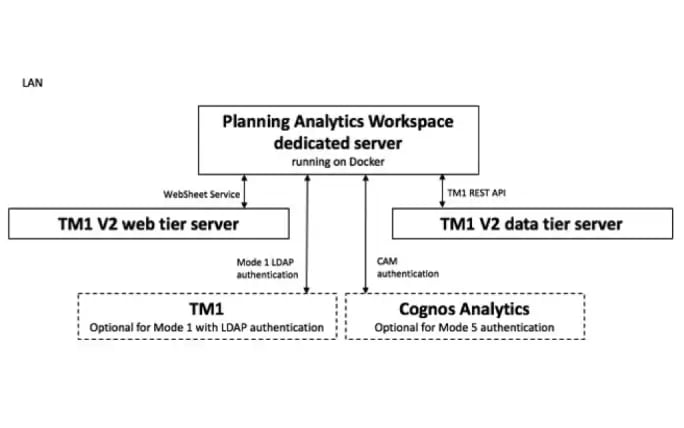
IBM PA Workspace
As a new face of the Cognos TM1/IBM Planning Analytics solution, IBM's PAW delivers a rich, interactive user interface where you can easily build analytical and planning applications or dashboards by combining cube views, web sheets, scorecards, and data visualizations. It is flexible enough to export to excel and publish the same data to workspace. And, you can now create dynamic reports via active forms for planning and budgeting, and gain insight and discovery via data visualisations from a very clean UX workspace and dashboard – even easily share content, reports and dashboards between users.
Highly Clean and Visual View-Based Interface: The interface is a highly visual, freeform design with over 25 charts, scorecards, images, shapes and many other options. You can easily synchronize data between different objects (cube views, web sheets etc.)
On Premise and On Cloud: An amazing innovation is Planning Analytics Workspace (PAW) and its two variants. One, being on premise called Local. And the other, is cloud based referred as on Cloud.
It is a data rich tool, that can show data from all different cubes, to meet business needs: PAW is also view-based, which means you can import multi-dimensional data into a workspace and then it effectively converts and displays it as a chart to map your visualisations (whether it is a bar graph, scatter graph, line graph or so forth).
Easily share between hundreds of users: PAW is a highly interactive viewer that makes it easy to swap data exploration to charts. The main advantage of a drag and drop workspace, unlike some other platforms that require you to write the rule for reports yourself, is that business users can easily build and share their own reports and dashboards.
Support Analysis, Reporting and Write-back features: So for example if you require write-back or what-if analysis of data, or need the aggregate data from high-volatility APPs in real-time, users can benefit from PAs consistent performance and tightly controlled latency of cached and non-cached data.
Mobile Compatibility: Workspace is mobile and can be accessed from tablets and iPads! Aside from supporting all your web interfaces such as Chrome, Safari, Explorer and Mozilla, you can even access work on the go from meeting to meeting, with mobile compatibility access. This full service analytics solution supports faster loading and scrolling for both web and cloud interfaces that enables high performance across WAN wireless access networks, and has iPad mobile compatibility.
Fast Querying and Loading Time: A T1 debugger in PA now uses a TM1 server as part of the back end. This means whether you are on a web browser or cloud interface there are less latencies and errors in querying, building or visualising reports, as opposed to traditional BI engines. Loading time is two (2) to four (4) times faster.
PAW comes with the above features and more such as combing additional highly versatile visualization features.
What makes your additional visualisation plugins unique with IBM PAW is that it does not require additional add-on licenses!
PAW Installation
On the other hand, the installation of PAW is not as smooth sailing as a TM1 or Cognos BI installation. PAW needs an additional software called Docker to be setup before installing PAW. Once docker is installed and ready to use, the next step is PAW installation.
The following diagram shows where Planning Analytics Workspace fits into your IBM Planning Analytics Local architecture:
Installation Workflow
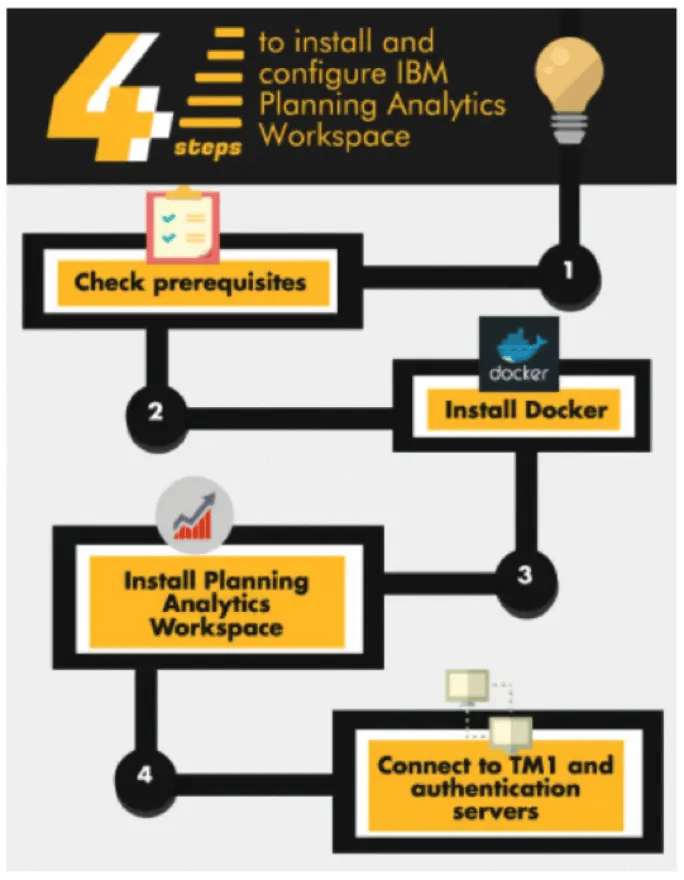
Though the installation process looks simple, this needs technical manual assistance to fix issues and make installation and configuration a success.
If not all TM1 Experts, at least 98% of technical consultants who would have tried to upgrade from TM1 to PA, whilst installing PAW, would have encountered below error.
Fixing this issue may cause delay in upgrading your system. It may also incur costs to fix this issues in non-prod environment. Once the non-prod is fixed, an outage or planned reboot, as well as BIOS changes are musts to fix the prod environment.
Benefits of PAW on Windows 2016
PAW for Windows 2016 has been available since June 2, 2017 ( 2.0.21).
Let us consider your clients business objectives for a second. Your companies strategy and technolocy benefits from embacing business intelligence trends that has been made available via systems such as the new PAW package support for Windows 2016 OS.
Again, docker is a must for getting PAW installed and configured on Windows 2016. The docker used here is not a native docker but a different docker called docker EE.
What’s the Gain with PAW for Windows 2016 OS?
Microsoft has come long way with confounding features. The most versatile features, we would say, are:
- Nano Server: A Nano Server boasts a 92 percent smaller installation footprint than the Windows Server graphical user interface (GUI) installation option.
- Containers: Docker-based containers to Windows Server.
- Linux Secure Boot: Deploy Linux VMs under Windows Server 2016 Hyper-V with no trouble without having to disable the otherwise stellar Secure Boot feature.
- Storage Replica and ReFS: ReFS is intended as a high-performance, high-resiliency file system intended for use with Storage Spaces Direct and Hyper-V workloads.
- Storage Spaces Direct: More affordable for administrators to create redundant and flexible disk storage.
- Nested Virtualization: Nested virtualization refers to the capability of a virtual machine to itself host virtual machine. Nested virtualization makes sense when a business wants to deploy additional Hyper-V hosts and needs to minimize hardware costs.
- Hyper-V Hot-Add Virtual Hardware: We can now "hot add" virtual hardware while VMs are online and running.
Gain for PA and PAW Administrators
- The first and foremost advantage is that there is no need to have a Virtualize active in VMWARE.
- As there is no need to activate Virtualization, physical server is not required instead a VM can be used for the PAW. Thus reducing not just the cost involved with money but also the time and effort must be counted.
- Embracing new Windows OS with new features means that you can be rest assured in regards to the performance and availability of PAW – which was not the case with TM1 10x.
- Storage Replica is an amazing feature in Windows 2016, this helps during failovers and quit turnaround at critical times.
- All leading to reduced expenses.
Contact one of Octane Software Solutions specialists for an upgrade made easy today!
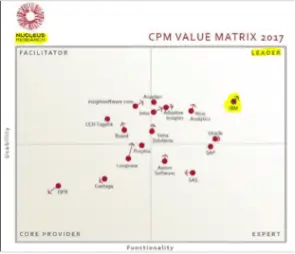
Planning Analytics is one of the reasons that makes IBM a market leader performance management quadrant.
- We are experts in this Cognos TM1 technology, having extensive experience in upgrading TM1 from older versions to newer Versions.
- Migrated our client’s system from IBM TM1 9x and 10x versions to new trending technology called Planning Analytics TM1.
- Installed Planning Analytics Workspace and integrated with Planning Analytics.
- Installed, configured Planning Analytics with Planning Analytics Workspace on Windows 2016, other Windows OS, AIX, Linux.
You may also like reading blogs “ What is IBM Planning Analytics Local ” , “IBM TM1 10.2 vs IBM Planning Analytics”
Who are Octane Software Solutions?
Octane Software Solutions is an official IBM Business Partner. We specialise in performance management solutions including on-shore and off-shore TM1 delivery. We provide our clients advice on best practices in Business Intelligence and scaling up applications to optimise your return on investment. By working with Octane you do not need to compromise on delivery, support, expertise, and training for end-to-end solutions that are cost effective as well as competitive.
For more details, please visit: www.octanesolutions.com.au
Srinivas is a Senior Technical Consultant at Octane Software Solutions. Learn more about Srinivas via LinkedIn.
Contents
- How to Create Dynamic Parameters for TM1
- How to Build a Scorecard using TM1 Architect
- How to Enhance TM1 Security on a 'Need to Know' Basis
- How to Use Stargate Views for TM1 Cube Viewer
How to Create Dynamic Parameters for TM1
The CheckFeedersMaximumCells is a dynamic parameter that allows users to restrict and control performing check feeders operation in a cube for a selected number of cells. As per the documentation, the default value is 3,000,000, meaning feeders for consolidation with up to 3 million intersections could be checked against, by default.
Case in point: I’ve added the CheckFeedersMaximumCells parameter in tm1s.cfg file and set the value to 1, implying that the Check Feeders should only apply to not more than 1 cell.
CheckFeedersMaximumCells =1
Post the change, let’s look at real life results of adding this parameter:
In the above screenshot, I’ve performed a Check Feeder operation on one cell and it aptly shows the result.
However, if I were to do the same on a consolidation, “PG1”, it throws an error as illustrated in the screenshot below.
.jpg?width=334&height=341&name=dynamic%20parameters%201%20(1).jpg)
Note 1: If the intersections or parameter value exceeds 99, the number format is displayed in scientific notion.
Note 2: If you would like to effectively disable checking feeders for whatever reason, you can do so by assigning -1 value for the config parameter.
How to Build a Scorecard using TM1 Architect
Cube used: Sales_Plan
Dimensions: Subsidiaries, Channel, Product, Month, Versions and Sales_Plan_Measures
To Add Traffic Lights in TM1 Architect follow the steps:
1. Enhance the Metrics Dimension
A Metric Dimension contains your collection of important measures or key performance indicators (KPI) that you want to monitor in your business.
- Add 2 Attributes (Numeric) in ‘Sales_Plan_Measures’ Dimension namely ‘Performancepattern’ and ‘Tolerancetype’.
- Enter a value of 2 for ‘Unit Cost’ element in ‘Tolerancetype’ Attribute and let rest of the elements be 0.
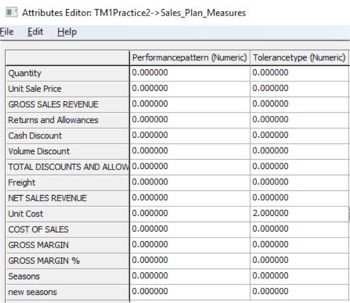
2. Enhance the indicator dimension
Scorecarding, a Metric indicators dimension provides more information about your key performance indicators (KPI) or metrics. Examples of metric indicators include Score, Status, and Trend.
- Insert a New Attribute in ‘Versions’ Dimension and name it as ‘Renderer’.
- For Status member enter the ‘Renderer’ value as ‘trafficlight’.
- For Trend member enter the ‘Renderer’ value as ‘metrictrend’.
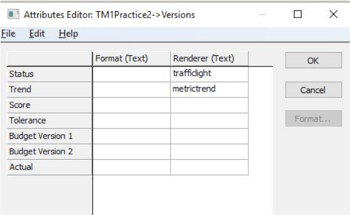
3. Enhance Time Dimension
- Enter a New Attribute in ‘Month’ Dimension and name it as ‘Previous’.
- Populate the ‘Previous’ Attribute with the invariant name of the preceding period from the level. (Example: For Feb enter ‘Jan’and so on).
How to Create a TM1 Security Overlay
Security Overlay is a type of cell security which restrict user’s ability to write to a cube, without causing change on the dimensions and without needing to change the underlying TM1 Security. Security Overlay prevent updates to cell data by all users, except Administrater.
Using Security Overlay Cube you can define the restriction to only selected dimensions of the Cube, as with Cell Security. Security Overlay does not apply to an Admin User, whereas the Cell Security can be applied to Admin including other users.
The Security Overlay cube is prefixed just like other Security Cubes.
} SecurityOverlayGlobal_CubeName
Security Overlay cube contains all the mapped dimensions from the cube and the last dimension is the ‘}SecurityOverlay Dimension’.
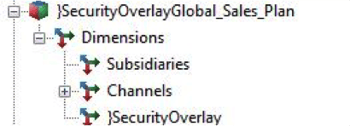
}SecurityOverlay dimension defines the data stored in the Overlay cube. It contains a single string element called ‘OverlayData’, which stores the data that is used to implement the Overlay. In OverlayData value ‘1’ must be entered to restrict write access in all intersections corresponding to the dimensions in Security Overlay cube.
To create Security Overlay cube via TI, use ‘SecurityOverlayCreateGlobalDefault’ function must be used.
This function can be called either in metadata or prolog tab as the functions that updates or create security must not be used in Data or Epilog tabs
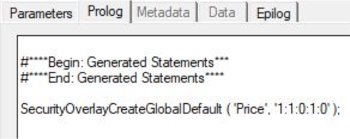
As per the above screenshot the price refers to the cube name. There are 5 dimension in the Price cube. Number ‘1’ indicates that the dimension is included in the Security Overlay cube and ‘0’ indicate the dimension is excluded.
As per the TI function in above screenshot it creates a Security Overlay cube with 1st, 2nd and 4th Dimensions.
Below is the screenshot of the Security Overlay Cube View
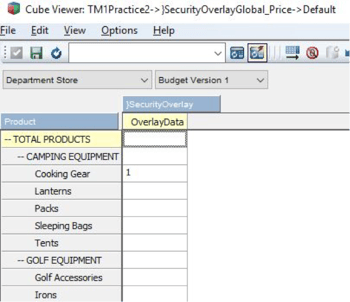
As per the above screenshot populated value 1 is entered in the intersection of ‘Department Store’, ‘Budget Version 1’ and ‘Cooking Gear’ which results in giving read access for all the intersections that has ‘Department Store’, ‘Budget Version 1’ and ‘Cooking Gear’.
Below is the snapshot of how the Security Overlay Cube View looks like after applying Security Overlay to the other users
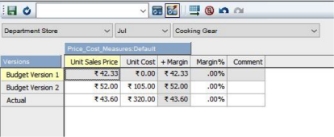
As per the above screenshot the intersection of Department Store, Cooking Gear and Budget Version 1 is not editable and all the other cells are editable.
The way Security Overlay Security diffrenciates from TM1 Cell Security is that TM1 Cell Security can be given different privileges like READ, WRITE, LOCK, NONE, RESERVE and ADMIN, whereas in Security Overlay Cube everyone is given READ access except the Admin. Cell Security can be given to all users including Admin.
There is no requirement to execute any process after u update the Overlay Security Cube and the impact of cell security comes into effect immediately. There will be no time lag or need of refreshing the security.
‘SecurityOverlayGlobalLockNode’ function must be used to restrict the access rights of a node to read-only by locking it.
Security Overlay Cube can be deleted or destroyed using a ‘SecurityOverlayDestroyGlobal’ Turbointegrator function.
To create Cell Security cube via TI, use ‘CellSecurityCubeCreate’ function must be used, similarly to ‘CellSecurityCubeDestroy’ function can be used to destroy Cell Security Cube.
How to Use Stargate Views For TM1 Cube Viewer
A Stargate View is a subsection of TM1 cube which is created by TM1 when you browse a cube with the Cube Viewer. It is also known as ‘View Cache’. Stargate View is different from a TM1 view object, and hence does not contain the formatting information and browser settings that are available in a view object.
Stargate View helps in accessing the cube data more rapidly than the TM1 object (Actual Cube View). Stargate View contains only the data for a defined section of a TM1 cube.
Stargate View contains only the data defined by the title elements and row and column subsets.
TM1 stores a Stargate view when you access a view that takes longer time to retrieve than the threshold defined by the VMT property in the }CubeProperties control cube. If a VMT value is not defined, a Stargate view will get generated when a view takes longer than five seconds. This is the default threshold when VMT is not specified in the }CubeProperties control cube.
A Stargate view persists in memory until the browser view from which it originates remains unchanged. If the view is changed and you recalculate the browser view, TM1 replaces the existing Stargate view in memory with the new one based on the recalculated view.
TM1 removes the Stargate View or Cache when you close the browser view and it will also be removed if you restart the TM1 Application.
TM1 provides some settings to control the Stargate View namely VMT (View Minimum Time) and VMM (View Maximum Memory), which can be seen in ‘}CubeProperties’ control cube.
VMM is expressed in KB. If we don’t specify any value, then a default value of 128 is used.
VMT is in seconds. If no value is specified, then a default value of 5 is used.
Try out our TM1 $99 training
Join our TM1 training session from the comfort of your home
As business implements more and more technology to streamline their operations the benefits of saving time, minimising costs, increasing productivity and better accuracy are starting to be realised. This means this is hardly a trend that will fade anytime soon. If you or your business are not 'there yet' it’s better to catch up now rather than being left behind with the rest of the competition.
We've moved on from the times when cloud technology was an unknown territory for especially for Accounting and Finance but the industry players are now fully aware, prepared or in cloud. This leaves us to ponder where to next? I think people are now starting to set their attention to the adoption of artificial intelligence (AI) and we can see that this is happening at a much faster pace.
Both Data and work as we know it will be strongly affected by AI. With bots now able to determine and sort the information into different accounts by themselves, meaning AI is already delivering solo performances in the field. Further to this, Bots can tell and organise data coming from the same source into different categories, so if you have a monthly subscription and or one off purchases coming from the supplier, bots will automatically understand that they are of a different nature and will set them under different chart of accounts. Machine learning is also observable since these bots can learn from various human inputs to make better judgments and to adapt to accounting professionals’ behaviour patterns.
The effect or major changes due to AI on the typical Accounting and Finance role will have one of two observable outcomes:
- The menial / administrative tasks as they stand right now are slowly becoming scarcer, even some operational tasks traditionally performed by accountants, such as dedicated accounts payable and accounts receivable ones, are already being performed by AI or are outsourced.
- The other observable is the way accounting and finance will be structured within the organisation more than likely a small footprint but they have a greater impact.
The results of the above inevitably are better performance and enhanced cost reductions and although AI is already finding its way into the finance and accounting industry, it’s not been fully adopted quite yet. Without a doubt, the accounting industry has a bright future ahead with a focus more on value add than the menial.
Part 2 of this article might be a review of the tools avaialble. What do you think? Was my assessment fair? Leave comments, or feel free to reach out on social media.
As a TM1 consultant, one of our challenging tasks is improving performance.
Often dynamic subsets cause memory leakage and in turn affect performance. Let’s discuss, how to convert dynamic subset to static subset with an example.
For Example, the “account1” dimension in SData instance has dynamic subset called “All Members”. Any operation done in the dynamic subset like delete/insert, will make subset has static. The below snippet of code to covert the dynamic subset to static (TI process can be downloaded in the bottom of the blog).

Before running the above code After running the above code

If you are using TM1 10.2.2 or above, the same operation can be done using “SubsetMDXSet” (undocumented function). The syntax of the function is
SubsetMDXSet( dimension, subsetname, [ MDX_expression]);
|
Example,
SubsetMDXSet ( ‘Account1’ , ‘All Members’ , ‘’ ) ;
With today's increase in data volumes it is becoming more important to handle the high demand (either loading or accessing) of data conccurrently or in parallel. This blog will assist you by noting the benefits, enabling the functionality, as well as giving you an example.
Let's start with the what parallel interaction / concurrency is and it benefits:
- It's a IBM server feature allowing concurrent operations (read/write).
- The concurrency operations can be performed on the same cube object.
- Writing to a cube will not lock it. This means that it will not wait for readers using the same cube to finish their read operation.
- It enabes the execution of read and write operations at same time.
- Data spreading over the high-level element will be faster.
- Freshly entered data retrieval will be faster for the users
So to implement we can segregate the implementation into two sections,
- cfg changes
- Running TI using Command line interface
Configuration Changes
Enable the parameter- ParallelInteraction in tm1s.cfg
- By default, parameter value set to F(FALSE)
- Enable the parameter by setting values as T(True)
- ParallelInteraction=T
- By enabling the Parallel interaction, that enables parallel interactivity for all the cube
Running TI using Command line interface
- By using TM1RunTI, we can trigger TI process from command prompt
- TM1RunTI execution can be done both synchronous mode or an asynchronous mode
- In synchronous mode, TM1RunTI trigger the TI process and wait for TI to return the control over the TM1RunTI
- In asynchronous mode, TM1RunTI trigger the TI process, once after the TI execution started, it returns the control over to TM1RunTI
Example
In this example data will be loaded to different years of same cube at the same time.
Parallel Interaction is best illustrated while using TM1RUNTI function to load data into a cube for different years.
Now assume that loading data into TM1 for a year is taking a long time as there are billions of records and has complex logic in TI process.
The time taken while loading data into TM1 can be reduced to almost 1/12 of the time, by parameterizing the process to load by month and using parallel interaction i.e., using TM1RUNTI
Syntax and the usage of TM1RUNTI.
Syntax:
If you are confused on the command prompt parameters. Follow the procedure below.
Open the Command Line. Here, change the directory to the Cognos_TM1\bin folder (where TM1 is Installed) and enter the following command as shown in screenshot:
tm1runti -?
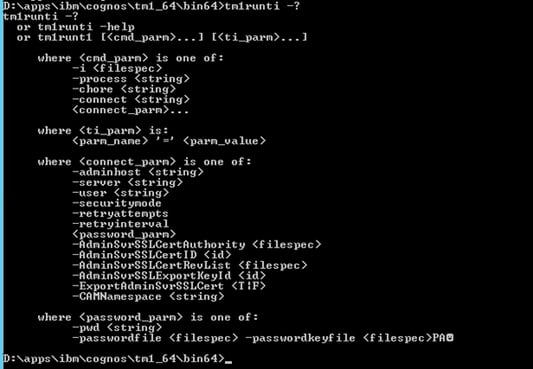
Usage:
vCommand = ‘d:\Program Files\ibm\cognos\tm1_64\bin64\tm1runti.exe -process zz_Summary_Load pMonth="Jan" pView = “JanView” -adminhost localhost -server SData -user admin -pwd "apple" ‘ ;
In the above command line, we have used hardcoded user name and password. We can also use Password file which is encrypted.
Syntax when using Password file
vCommand = ‘d:\Program Files\ibm\cognos\tm1_64\bin64\tm1runti.exe -process zz_Summary_Load pMonth="Jan" pView = “JanView” -adminhost localhost -server SData -user "admin" -passwordfile "D:\Program Files\ibm\cognos\tm1_64\bin64\cfmcognosprk.dat" -passwordkeyfile "D:\Program Files\ibm\cognos\tm1_64\bin64\cfmcognoskey.dat"
when we need to run the above command in TM1, we can use a function ExecuteCommand in TI Process.
Create a TI Process. Here created a process as zz_TM1RUNTI
ExecuteCommand(vCommand, 0);
From the command line specified above zz_Summary_Load loads into a cube using month as a parameter. To make process run in parallel one must be sure that Process is using different views to avoid locking.
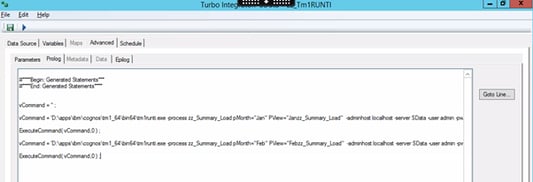
When process is executed, even process completed successfully from the below screenshot. The process which is executed in command line is triggered through command inline interface of TM1. Which can be seen running parallel in TM1TOP as shown below.
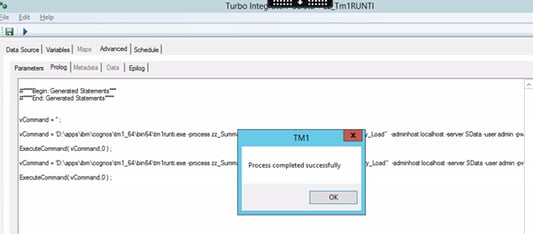

I hope you've found this useful and be sure to sign up below for updates from the comments section OR sign up to our blog for all the latest and greatest.
For more great content click here
I have been closely following and writing about trends in the business intelligence market over the past three years. During this time, I can’t say that we’ve seen any “radically new” trends, and I don’t expect any to emerge in the second half of 2017. What I have seen, so far in 2017, is the “evolution” of the dominant trends driving a dynamic BI market. The global business intelligence market is expected to reach USD 26.50 billion by 2021, growing at a CAGR of around 8.4% between 2016 and 2021 (Zion Market Research).
Here are the 5 BI trends predicted to most influence the BI market in 2017
1. Data Visualisation/Discovery – most important trend
Although the trend to Data Visualisation/Discovery is not new, it ranks as the most important business intelligence trend in 2017 by BARCS BI Trend Monitor. With the explosion of “big data,” this finding is not surprising. It is virtually impossible to decipher huge amounts of data from a wide variety of sources in static rows, charts, and tables. Data visualisation allows us to use our brains’ visual pattern recognition capabilities to digest and identify the most relevant information faster. BI users recognise the value of visualisation to identify hidden trends and patterns in data, to track business performance, to mitigate risk, and to seize new opportunities.
2. Self-Service BI – a high priority
According to Gartner’s 2016 Business Intelligence Magic Quadrant, BI has moved “past the tipping point of a more than 10- to 11-year transition away from IT-centric reporting platforms to modern BI and analytics platforms”. In fact, Gartner foresees that by 2020 self-service BI platforms will make up 80% of all enterprise reporting!
As we are all aware, “big data” has been growing at an exponential rate. Correspondingly, self-service analytics has been growing in direct proportion to the increase of data available to analyse. Business teams have been eager to seize the opportunity to use the data to improve business performance. They have been frustrated by dependence on busy, often understaffed IT teams for all their reporting needs. This has led business teams to clamor for modern self-service BI platforms that allow them to rapidly gain insights from data for a better understanding of their business and customers.
3. Self-Service Data Prep/Integration – rapidly emerging
While most trends in the BI market are relatively stable, there has been a surge of interest for self-service data integration for business users. We hear from many clients that data preparation is one of the most difficult and time-consuming challenges they face when using self-service BI and analytics tools. According to Rita Sallam, research vice president at Gartner, the industry has responded to this data challenge. “Data preparation capabilities are emerging and will provide business users and analysts the ability to extend the scope of self-service, enabling them to access, profile, prepare, integrate, curate, model and enrich data for analysis and consumption by BI and analytics platforms.” Similar to what self-service BI platforms have done for traditional IT-centric BI, Ms. Sallam predicts that self-service data integration will, “Reduce the significant time and complexity users face in preparing their data for analysis and shift much of the activity from IT to the business user to better support governed data discovery.”
The self-service trend in data integration is expected to become more and more mainstream forcing leading data integration vendors to offer options and interfaces as well as governance frameworks for data integration by business users. In addition, BI vendors are adding value to their analysis and data visualisation tools by extending their own business user data capabilities to include more-advanced data preparation features (BARC).
4. Cloud Data and Cloud Analytics – on the rise
In the past, many companies have been reluctant to share data in the cloud due to data security concerns. However, more and more organisations now consider data security to be a major benefit of transitioning to the cloud because cloud vendors often have more resources allocated to manage security than any single company has. It makes sense for business analytics to be in the cloud since a lot of sales, marketing and financial data already resides there. According to an industry report (IDC’s FutureScape), the use of cloud analytics will become more pervasive, and through 2020 spending on Cloud-Based Big Data and Analytics Technology is expected to grow 4.5x faster than spending for on-premises solutions.
76 percent of organisations in IDC’s survey cited speed to deployment as the top reason for going to the cloud. Other reasons were: the facilitation of collaboration internally as well as with partners and customers; no requirement for buying or configuring hardware; more scalable solution and licenses can be easily added as needed.
5. BI Governance – needs to “grow up”
When it comes to governance for BI, there seems to be a lot of room for improvement. As the responsibility for reporting becomes increasingly scattered among different individuals and departments, governance has become much more challenging. In the past, limited governance of self-service BI implementations has allowed better data access for business users but has sometimes led to data redundancy, data privacy and security breaches, and even instances of public disclosure inconsistencies. Self-service BI projects require a fine balance between flexible access to data and data governance for data discovery and distribution that results in an agile, data-driven culture.
Although BI analytics has increasingly been placed in the hands of the business user, it is paramount that IT remains involved in its governance. BI governance works best when IT and its business partners jointly define and implement an infrastructure that supports the BI strategy and enterprise goals. Governance infrastructure should address the distribution, complexity, flexibility, and cost of BI. An agreed data and BI tool governance framework is essential to avoid losing control over data.
we go the extra mile so you can go the distance|
Got a question? Shoot!
Lorem ipsum dolor sit amet, consectetur adipiscing elit, sed do eiusmod tempor incididunt ut labore et dolore magna aliqua.

.png)




.png?width=673&height=371&name=IBM_Gold-removebg-preview%20(1).png)
Leave a comment