Dashboards:
Distinction between Display and Use value in dashboards:
You can now define Display and Use values in data modules.
The Display values are the values that you can see in a dashboard UI; the Use values are primarily for filtering logic.
Previously, defining the Display and Use values was possible only in FM packages. This feature brings the same capability to data modules and enhances consistency across dashboards and reporting. You can interact with readable values while filters apply precise underlying identifiers. For example, you can select a Customer ID value in the dashboard UI and apply a filter that is based on the Customer Name value.
Manage filter size and filter area visibility:
You can now resize filter columns and hide filter areas to improve the arrangement and visibility of these elements in dashboards.
For more information on resizing filter columns in the All tabs and This tab filter areas, see Resizing filters.
For more information on hiding and reshowing the filter areas, see Hiding and showing filter areas.
Option for users to export visualisation data to a CSV file:
You can now allow your users to export visualisation data to a .csv file.

To enable this feature, open a dashboard or a report that contains a visualisation, go to Properties > Advanced, and turn on the Allow users access to data option.
When this option is active, users can open the data tray and download the .csv file from the Visualisation data tab. Enabling this feature also adds an Export to CSV button and Export to CSV icon to the toolbar. The button is visible to the users and to the editors. If you turn off this feature, the button disappears.
Responsive dashboard layout:
The 12.1.1 release introduces a responsive layout feature for dashboards.
This feature enhances the authoring experience and usability across different devices by optimising the dashboard layout for various screen sizes, including mobile devices. You can also use it for grouping the content and organising visualisations.
To use a responsive layout, go to the Responsive tab when you create a new dashboard and select one of the available templates, as seen in the following image:

The responsive dashboard layout feature comes with the following key capabilities:
You can now choose between responsive and non-responsive layouts when you create a new dashboard.
If you change the position of a panel or resize the dashboard window, the widget automatically adapts its placement and alignment.
- Intuitive resizing and swapping:
Smart alignment algorithms facilitate smooth layout transitions, while an intuitive interface makes the authoring experience smoother and more efficient.
- Drop zones for precise widget placement:
Each layout cell supports five drop zones: top, right, bottom, left, and center. You can use these zones for more control over widget placement.
Dashboards now differentiate between empty and populated cells for accurate deletion.
The feature mirrors data population from the non-responsive layouts, supports drag-and-drop function, and slot item selection. If you use the copy and paste or click-add-to functions, the feature uses a smart placement logic to make sure that it adds the content to empty cells. It can also split the data between existing cells.
You can now dynamically resize a dashboard and its layout automatically adapts to the new screen size. It includes transition to a single-column or two-column layouts on smaller screens for enhanced readability.
You can print the dashboard to a .pdf file in View mode and in the New Page mode.
- Nested dashboard widgets:
You can use the nested dashboard widgets as standard widgets or as containers for grouping and organising the content.
To successfully implement the responsive layout, you must make sure that the dashboard uses manifest version 12.1.1 or later and confirm widget boundaries by employing the layout grid. However, if the widgets do not render correctly, check the layout specification and verify the feature support.
Secure dashboard consumption with execute and traverse permissions:
Users can now consume dashboards with execute and traverse permissions granted to presented data, no read permission is required.
In the previous releases of IBM® Cognos® Analytics, the read permission was required for dashboards consumption. This might cause a sensitive data compromise because dashboard consumers could edit and copy such data.
Important: To strengthen the protection of data that you want to be consumed by other users, modify these users' permissions from Read to Execute and Traverse before you migrate to Cognos Analytics 12.1.1.
However, the execute and traverse permissions put some restrictions on actions that can be taken by a dashboard consumer. Therefore, the consumer cannot perform the following actions:
-
Drill up and down
-
Export
-
Narrative insights
-
Navigate
-
Open dashboards
-
Paste copied widgets into another dashboard.
-
Pin
-
Save
-
Save as a story
-
See the full data set in the data tray.
-
Share
-
Switch to Edit mode.
Personalised dashboard views:
The 12.1.1 release comes with a new feature for simplified customisation of complex dashboard designs.
A dashboard view is a feature that references a base dashboard, which contains your individual filters and settings. It supports the following customisation features:
You can create dashboard views only from an open dashboard and from within the dashboard studio, and only against saved dashboards. If the open dashboard is saved, a Save as dashboard view option appears in the save menu:

This operation works as a standard Save as operation. When the operation is complete, the original dashboard is still displayed. To access the new dashboard view, you must open it manually from the content navigation panel.
The dashboard views have a different icon from regular dashboards. It includes an eye overlay, which is similar to a report views icon:

You can customise a dashboard view by changing the brushing, filter, or bookmarks, and then saving the view. However, the dashboard view is essentially in a Consume mode, and you can't switch to the authoring mode. It also means that you can't access the metadata tree of the dashboard view or add extra filter controls to the filter dock. If you want your users to apply filters in a metadata column, you must first add that column to the base dashboard, even if you don't initially select any filter values.
Any updates that you make to a base dashboard automatically appear in the dashboard view, except for the custom options that you define in the dashboard view itself. You can see the changes the next time that you open the dashboard view. For example, if you delete a visualisation from the main dashboard, it no longer appears in the dashboard view.
The Save as dashboard view operation also creates a non-editable bookmark in the dashboard view. This bookmark includes the state of filters and brushing that you applied in the dashboard at the time when the dashboard view was created or last saved. When you open the dashboard view and don't select any other bookmark, this bookmark is automatically selected.

The dashboard views not only consume bookmarks from the base dashboards, but they also can have their own bookmarks. You can create them in the same way as in standard dashboards. The Cognos® Analytics UI differentiates between Shared bookmarks, so all bookmarks from the base dashboards, and My bookmarks, which are bookmarks from the dashboard view.

If you delete the base dashboard, you can't open the dashboard view, and its entry is disabled in the content navigation. All attempts to access that dashboard view by entering its URL address directly into a browser result in an error message. Also, the Source dashboard property appears as Unavailable, for example:

Reporting:
Enhanced clarity of reporting templates view:
Release 12.1.1 enhances the user experience of navigating through report templates.
When you open the Create a report page, it shows only templates that match the Report filter value. This change hides all Active Reports templates by default and makes only the Report templates visible.

You can use the Filter icon to customise your view. To maintain a personalised experience, Cognos® Analytics saves your selection in local storage or by using the cached value.
This enhancement also comes with upgraded filter labels, which reflect the current filter value, for example: Showing All Templates, Showing Report Templates, or Showing Active Report Templates.
Manage queries in the report cache:
You can manage which data queries are included in the report cache to control report performance.
For more information on the report cache, see Caching Prompt Data.
For example, queries to data sources that cannot be accessed by all users, user-dependent, might degrade the report performance.
You can exclude report performance-degrading queries from cached prompt data by setting the value of the Report cache property to No in the query property pane:
For multi-level queries, this value is transferred from the lowest-level to the highest-level query.
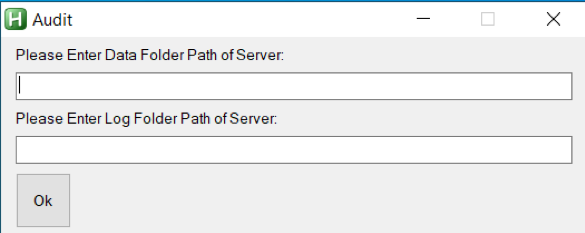
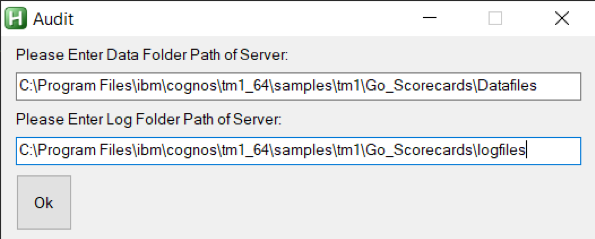
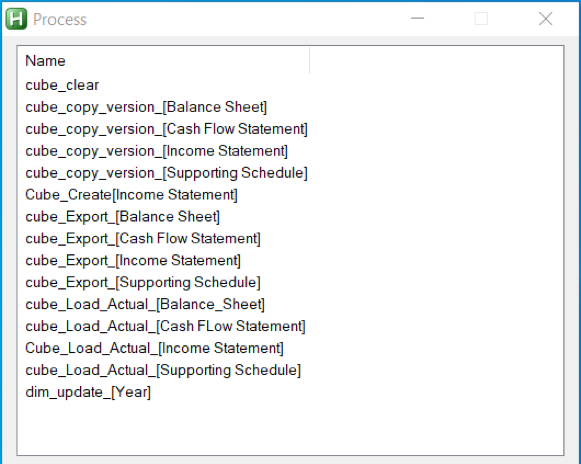
PostgreSQL audit deployment and model:
The 12.1.1 release comes with a new capability for enhanced auditing and reporting in environments that use PostgreSQL as the auditing database.
You can use a dedicated Framework Manager model and a deployment package to run reports against a PostgreSQL audit database. These resources provide a structure for analysing the audit data and creating insightful reports.
You can access the new samples in the following locations within your installation directory:
<installation>/samples/Audit_samples/Audit_Postgres
<installation>/samples/Audit_samples/IBM_Cognos_Audit_Postgres.zip
To use the PostgreSQL audit samples, make sure to create a data source connection named Audit_PG.
Master detail relationships with 11.1 visualisations:
You can use 11.1 visualisations in master detail relationships to present details for each master query item in a consolidated, insightful way.
For more information on master detail relationships, see Master detail relationships.
For the 11.1 visualisations as the detail objects, you can now choose if the same automatic value range is used in all visualisation instances in a master detail relationship. You apply your choice to the Same range for all instances of the chart option. To turn this option off or on, perform the following steps:
-
Select Computed.
-
Turn off or on the Same range for all instances of the chart option, depending on whether you want to use in the instances the global extrema, the biggest value range of all instances, or the local extrema, the value range of each visualisation.


.png)
.png)
.png?width=595&height=341&name=From%20Insight%20to%20Impact%20(1).png)


.png?width=499&height=286&name=Agentic%20AI%20blog%20(1).png)

.gif?width=559&height=320&name=TM1%20newsletter%20(1).gif)

.png?width=567&height=302&name=fiji%20blog%20(1).png)
.png?width=426&height=323&name=social%20post%20(1440%20%C3%97%201080%20px).png)
.png?width=504&height=284&name=social%20post%20(3).png)
.png?width=520&height=293&name=social%20post%20(4).png)

.svg)


-1.webp?width=499&height=336&name=business-intelligence-tools-Dec-26-2022-10-02-06-5%20(1)-1.webp)


.webp?width=512&name=unnamed%20(2).webp)
.webp?width=434&name=unnamed%20(4).webp)
.webp?width=481&name=unnamed%20(3).webp)
.jpg?width=512&name=unnamed%20(1).jpg)


.jpg?width=334&height=341&name=dynamic%20parameters%201%20(1).jpg)


Leave a comment