Content_Cut_Icon Twitter_Brands_Icon

Views integration in PAX and PAW

Mode_Comment_Icon_white0
Alarm_Icon_1_white3 min

In the latest version of PAX (2.0.44) as well as PAW (2.0.44), IBM has added a new capability to allow the views to be shared between PAW and PAX using Planning Analytics Workspace Content Store. What does this mean for us? We can now save the views in content store and share it across to be accessed from either PAW or PAX which was not possible earlier. This further strengthens the integration ...

down-arrow-blue
Book_Open_Solid_Icon

In the latest version of PAX (2.0.44) as well as PAW (2.0.44), IBM has added a new capability to allow the views to be shared between PAW and PAX using Planning Analytics Workspace Content Store.


What does this mean for us?

We can now save the views in content store and share it across to be accessed from either PAW or PAX which was not possible earlier. This further strengthens the integration and make the PAX and PAW interoperation even more seamless which a good step as far as usability and software portability is concerned.


Steps to access the views from PAW content store from PAX:

We already know how to save the views in content store within PAW – this is done by clicking the save button in the view and selecting the destination folder in content store.

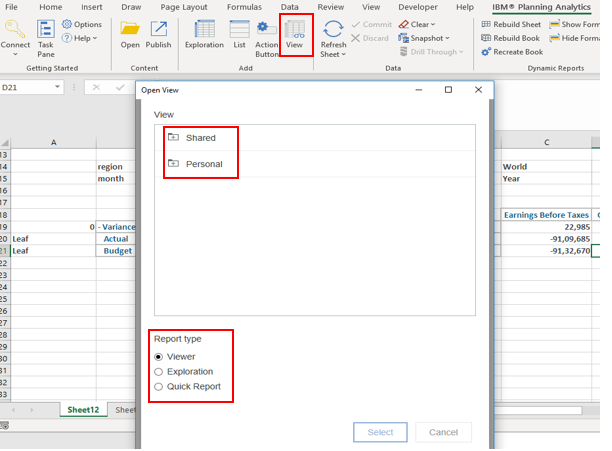
To access the views saved in content store, click at View icon available on PAX toolbar that opens the folder structure of the content store.

Navigate to the folder where the view is saved then select the desired Report Type from the bottom and click Select.
 

A1


Steps to save the views in PAW content store from PAX:

Note: This applies only to Exploration Views in PAX. For the other report types, they can be published to TM1 Applications folder from PAX and access in PAW. The saved exploration view when opened in PAW, opens as a normal view.

Open a view in Exploration mode and click Save View icon in PAX toolbar under Exploration tab.

You will be provided with two options to choose from:
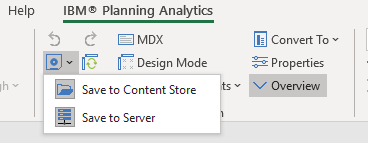
  1. Save to Content Store: This saves the view in PAW Content Store
  2. Save to Server: This saves the view to TM1 data server.


A2

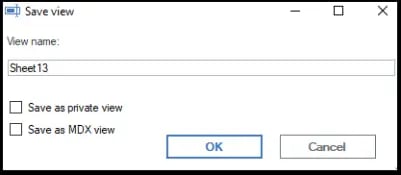
When saving the view to Server, there is an option to save it as MDX view, however, please note that if            this is checked, the view will not be accessible from Architect as Architect does not support MDX based            views.

       2.1 When saving the view


A3-1


Once the view is saved in PAW Content Store, it can then be accessed from PAW and any changes made to the view and saved in either of the platforms will be reflected across.

*Tip: You may still be able to create a view in PAW and save it to TM1 Server so it can be accessed from both PAX and Architect, however be mindful that if you make any change to the view in PAW and try to override the view, that will not be possible. It will only give you an option to save the view in PAW Content Store. It is possible to update the view and save the changes in PAX that is reflected across all platforms but currently not in PAW.

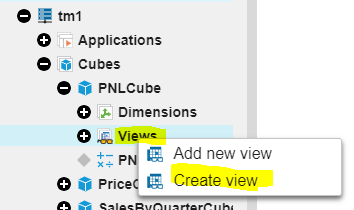
To create a view in PAW, right click the Views and select ‘Create view’. This view when saved will be saved in TM1 database directory and is visible in both PAX and Architect both.


A4


Leave a comment

Line

Why Your Power BI Reports Drift From TM1 (And How to Eliminate Flat-File Drift Forever)

Mode_Comment_Icon_black0
Alarm_Icon_117 min

Quick Summary: When Power BI board decks disagree with IBM Planning Analytics (TM1), batch CSV exports and scheduled ETL jobs are almost always the cause. Here is how modern finance teams eliminate data drift, protect payroll security, and connect TM1 directly to Power BI using live REST queries.

Target Readership: CFOs, Heads of FP&A, TM1 Architects, and Power BI Leads.

Every finance team recognizes the Friday afternoon reconciliation panic.

The CFO prepares to present the monthly forecast to the board. They open the executive dashboard in Microsoft Power BI. At the same time, the financial planning manager reviews the live consolidation model in IBM Planning Analytics (TM1).

The EBITDA numbers do not match.

The variance is small, but the damage is immediate. Executive trust evaporates. The finance team stops analyzing operational performance and spends the next four hours chasing spreadsheets across network drives.

This discrepancy is not a user error. It is an architectural failure known as data drift. Here is why traditional TM1 reporting pipelines drift, the security risks hiding in your flat files, and how to connect Power BI directly to TM1 without staging tables.

DataFusion Integration Architecture: IBM TM1 In-Memory Engine to Power BI Reporting Layer

Figure 1: End-to-end integration architecture: IBM TM1 multidimensional in-memory cubes streaming directly to Microsoft Power BI via the DataFusion OData v4 REST connector.

Failure Mode: Batch CSV Export Loop 12-24H Stale Latency

1. In-Memory TM1 Cube: Analysts update dynamic forecast assumptions →
2. TurboIntegrator Export: Overnight batch script runs ASCIIOutput to dump unencrypted CSVs to network drive →
3. Scheduled Power BI Refresh: Gateway reloads stale file snapshots. Late-day adjustments are missed.

Business Risk: Executive board decks disagree with live models. Unencrypted payroll and departmental margins exposed on shared drives.
Recommended: DataFusion Automated REST Link Scheduled & On-Demand Sync

1. TM1 v12 Cube: Single authoritative financial model in memory with cell security preserved →
2. DataFusion REST Connector: Lightweight (< 100 MB) local Flask bridge querying TM1 via OData v4 REST API →
3. Power BI Dataset: Queries TM1 on demand or on schedule with zero intermediate CSV staging and zero external data storage.

Business Outcome: Zero flat-file drift. One-click instant refresh with record counts displayed. Unlimited users, data, and servers.

1. The Anatomy of Reporting Drift

To understand why numbers drift, look at the path data takes from your TM1 cube to your Power BI visuals. In most organizations, this path relies on a batch export loop:

  1. The Live Plan: Business units enter revenue assumptions and labor headcounts into Planning Analytics Workspace (PAW). TM1 recalculates consolidated numbers in memory in real time.
  2. The Scheduled Export: Overnight, a TurboIntegrator (TI) process runs ASCIIOutput scripts to dump multidimensional cube slices into flat CSV files.
  3. The Shared Network Folder: These CSV files land on a local server or network drive.
  4. The Gateway Refresh: The Power BI on-premises data gateway triggers a scheduled import refresh early in the morning.
  5. The Executive View: Executives review the dashboard at 2:00 PM.

What happens if an analyst posts a late adjustment in TM1 at 10:00 AM?

The adjustment sits in TM1. Power BI will not reflect that number until the next overnight batch run. For an entire business day, your reporting layer shows stale figures. When organizations try to fix this by scheduling more frequent export scripts, they run directly into server locking issues, memory spikes, and fragile file dependencies.

2. The Three Hidden Risks of Staged Reporting

Batch exports create problems far beyond stale dashboard views. They introduce operational vulnerabilities that affect audit compliance, server stability, and data security.

Risk 1: Unencrypted Data Exposure

When you export TM1 data to CSV files, you strip away TM1 security. Unencrypted flat files containing sensitive payroll, executive compensation, and departmental margins often sit on network shares. Anyone with directory access can read these files. Staged reporting creates an unnecessary compliance risk for internal audit teams.

Risk 2: Brittle TurboIntegrator Maintenance

TurboIntegrator export scripts require hardcoded dimensions and element names. When your business adds a new entity, updates a cost center, or restructures a chart of accounts, those static TI scripts fail. Analysts must stop their planning work to debug broken scripts and adjust column mappings. If you want to review model health, read our TM1 Feeder Diagnostic Playbook.

Risk 3: Double Cloud Storage and Licensing Costs

Many IT teams try to solve flat-file drift by pushing TM1 data into an intermediate SQL database or Snowflake warehouse. This creates double data storage costs. You pay to store the data in TM1, and you pay again to host relational staging tables. Worse, you lose dynamic TM1 calculation rules. Every time rules change, engineers must rebuild ETL transformation pipelines.

3. Four Ways to Connect TM1 to Power BI: An Architectural Comparison

Finance organizations generally choose between four integration methods. Here is how they compare in production:

Integration Method Latency Cell Security Setup Complexity Server Load Impact
TI Flat-File CSV Export 12 to 24 Hours Stripped (Unencrypted) High Script Maintenance Moderate Disk I/O
Intermediate SQL Warehouse 4 to 12 Hours Rebuilt Manually Very High (Custom ETL) High Staging Overhead
Native Microsoft OData Feed Real Time Inherited Moderate (Power Query) High (JSON Memory Out)
DataFusion TM1 Connector Scheduled & On-Demand Inherited Automatically Low-Code (< 100 MB .exe) Low (OData v4 REST API)

While TurboIntegrator flat-file exports remain common, they treat an in-memory calculation engine like a static file dump. Similarly, Microsoft Power BI standard OData feeds struggle to parse complex multi-dimensional JSON views, frequently running out of memory during peak month-end refreshes.

The modern alternative is automated REST integration. DataFusion connects Power BI directly to the TM1 calculation engine using optimized OData v4 REST calls. It queries only the requested cube intersections, inherits cell security, and requires zero external data staging.

4. TM1 v12 and the Natural Shift to Direct REST Integration

Honoring TM1's Heritage: The Evolution of Manny Perez's Functional Database

For over forty years, TM1 has stood apart because of the functional database architecture Manny Perez pioneered in 1983: in-memory multi-dimensional calculations that traditional relational databases could never match. As TM1 evolves into TM1 v12, that core calculation power remains at the heart of the platform. The main evolution is how data flows around it. In containerized cloud environments without mapped Windows drives or local server file systems, integration naturally moves from batch text exports to direct, native REST APIs (like OData v4).

As organizations plan their upgrade path to TM1 v12, moving away from scheduled flat-file handoffs becomes a welcome simplification.

As detailed in our breakdown of IBM Planning Analytics Engine 12 Architecture, TM1 v12 runs on containerized microservices. In this modern setup:

  • TurboIntegrator processes run within isolated containers rather than relying on on-premises Windows batch scripts.
  • Ephemeral container storage makes external text file transfers unnecessary.
  • Reports in Power BI connect directly to the in-memory calculation engine through secure, governed REST interfaces.

DataFusion operates natively on REST protocols. It is designed to work with both traditional TM1 installations (10.2.2+) and containerized TM1 v12 environments without requiring architectural re-engineering.

5. Under the Hood: How DataFusion Works

According to the official DataFusion Technical Spec Sheet, the connector is engineered as a zero-overhead bridge designed specifically for finance and BI teams:

1. Prepackaged Standalone Executable (< 100 MB)

DataFusion runs as a standalone Windows application with zero external runtime dependencies, registry modifications, or complex client installs. It runs an embedded local Flask bridge on port 5000 (localhost:5000) to establish the direct communications link.

2. Direct OData v4 REST Connectivity

The software connects directly to the IBM Cognos TM1 REST API (default ports 5495 / 5498 SSL) using standard OData Version 4. It works seamlessly across IBM Cognos TM1 10.2.2 and above, Planning Analytics Local, and TM1 v12.

3. Selective Dataset & Metadata Link Generation

Users authenticate with their standard TM1 credentials, select the specific cube, dimensions, and views required for reporting, and click Get Link. DataFusion generates an encrypted, reusable link code for that specific dataset.

4. Universal BI Compatibility (Power BI, Tableau, Qlik)

Paste the link directly into Microsoft Power BI Desktop or Service. Power BI stores the link in its dataset library—once linked, it never needs re-linking. DataFusion also natively supports Tableau and Qlik.

5. Scheduled & On-Demand Sync with Record-Count Verification

Reports refresh automatically on your defined Power BI schedule or on demand. When users click Refresh manually in Power BI, an instant pop-up displays the exact count of records extracted from TM1 for transparent reconciliation.

Because DataFusion simply picks up and passes data discretely from TM1 to Power BI, customer financial data is never stored externally. The licensing model is straightforward: a 60-day free trial, setup in under 1 hour with Octane, and an unlimited subscription covering unlimited users, unlimited data, unlimited links, and unlimited servers (dev, test, prod).

6. Executive Action Plan: Eliminating Data Drift

To establish a single source of truth across your finance organization, follow these four steps:

  1. Audit Your Current Reporting Latency: Identify every report used by executive leadership. Measure the time delay between user input in TM1 and visibility in Power BI. If the delay exceeds 15 minutes, your pipeline suffers from data drift.
  2. Remove Flat Files from Shared Drives: Scan local network shares for exported CSV and Excel dumps. Replace unencrypted file paths with direct REST connections to protect confidential financial data.
  3. Align with Modern Support Models: Ensure your TM1 support team actively monitors REST integration performance rather than just fixing broken batch scripts. Review our guide on How to Evaluate IBM Planning Analytics Support Models to balance support capacity.
  4. Test Direct Query in a Pilot View: Select one high-frequency financial report, such as weekly cash flow or daily revenue tracking. Connect that cube directly to Power BI using Datafusion. Compare the refresh speed and data accuracy against your legacy batch export.

Eliminate the Friday Panic

Executive reporting should inspire strategic confidence, not spark data reconciliation debates.

When you connect Microsoft Power BI directly to the IBM Planning Analytics engine, you preserve the calculation power of TM1 while delivering instant, trusted visuals to leadership.

Ready to Modernise Your TM1 to Power BI Reporting?

Explore how the Datafusion TM1 Connector helps your finance team report like pros with zero TM1 development.

Explore Datafusion TM1 Managed Support
Line

Beyond the Monolith: Why IBM Planning Analytics Engine 12 Changes Everything for TM1 Architects

Mode_Comment_Icon_black0
Alarm_Icon_122 min

Quick Summary: IBM Planning Analytics Engine 12 (TM1 12) is the cloud-native re-engineering of the classic in-memory TM1 database engine. It replaces the 30-year-old monolithic server process (tm1s.exe) with containerized microservices on Red Hat OpenShift, enabling automated zero-downtime snapshots, elastic compute scaling, and secure REST-driven integrations.

Target Readership: TM1 Architects, FP&A Systems Leaders, and Finance Transformation Directors.

For three decades, IBM Planning Analytics (TM1) has powered the world's most demanding financial consolidation and operational forecasting models. Its in-memory calculation speed allowed finance teams to model complex multi-dimensional scenarios in seconds.

However, running enterprise TM1 on a monolithic architecture came with well-known operational friction:

  • 45-minute server reboot cycles during model maintenance.
  • Memory fragmentation requiring scheduled weekend reboots.
  • Heavy reliance on fragile operating system batch scripts via ExecuteCommand.
  • Client-side dependency on legacy 32-bit Windows utilities like TM1 Architect and Perspectives.

With IBM Planning Analytics Engine 12 (TM1 v12), IBM has rebuilt the infrastructure surrounding the TM1 calculation engine. Here is what TM1 architects, finance systems leaders, and FP&A directors need to know about TM1 v12, what changes under the hood, and how to prepare your models for the modern cloud-native era.

A Note to the Community: Keeping TM1 as TM1

In recent community discussions on LinkedIn, veteran architects and IBM Champions rightfully reminded us of an enduring truth: TM1 is TM1—the functional database pioneered by Manny Perez in 1983. While IBM marketing has cycled through product names over the decades (Applix TM1, Cognos TM1, Planning Analytics Local, PA Engine, and Engine 12), the soul of the technology remains Manny’s functional in-memory multidimensional engine. In this guide, whether we refer to it as TM1 v12 or IBM’s official packaging of Planning Analytics Engine 12, our focus is honoring that engine while dissecting the modern containerized infrastructure built around it.

1. The End of the 30-Year Monolith

In traditional TM1 (version 11 and earlier), every component of a TM1 database instance lived inside a single monolithic operating system process (tm1s.exe). When users logged in, queried views, ran TurboIntegrator (TI) processes, or saved data, everything competed for the same thread pool and memory space.

If an unoptimized feeder caused an out-of-memory error (as explored in our TM1 Feeder Diagnostic Playbook), the entire server instance could crash for all active users.

Lengthy Server Restarts

Loading dozens of gigabytes of cube data and recalculating feeders from disk on startup meant that any configuration change required taking the model offline for 20 to 60 minutes.

Fragile Operating System Dependencies

Many legacy TI processes relied on ExecuteCommand to trigger local PowerShell or Windows batch scripts to move files, create directories, or send notification emails. These scripts broke whenever underlying OS permissions or file paths shifted.

The 2026 Support Cutoff

Standard support for Planning Analytics 2.0.9 ended on October 31, 2025, and extended support concludes on October 31, 2026. Organizations still running legacy versions must modernize their architecture to maintain security compliance. If your team is reviewing support options, see our guide on How to Evaluate IBM Planning Analytics Support Models.

2. Inside Engine 12: Cloud-Native Microservices Architecture

Engine 12 fundamentally decouples the TM1 environment. Rather than running a single monolithic server, Planning Analytics 3.1 runs on a containerized, cloud-native architecture built on Red Hat OpenShift.

Figure 1: IBM Planning Analytics Engine 12 Cloud-Native Architecture Breakdown
RED HAT OPENSHIFT CONTAINER PLATFORM (ENGINE 12 CLUSTER) 1. Stateless Gateways SSO & OAuth 2.0 Auth Identity Token Routing REST API Gateway TM1 OData REST Endpoints PAW Web Session Router Zero-Lock Client Balancer [Scales on Demand] 2. TM1 Calculation Engine In-Memory Cube Pods Multi-Threaded Aggregations Rule Calculation Engine Feeder Evaluation & Stash Multi-Replica HA Dynamic Active Read Replicas [Isolated Memory Space] 3. Cloud Persistence Continuous Snapshots Zero-Downtime Backups Managed S3 Storage Cloud Object Repository Auto-Directory Gen Native AsciiOutput Paths [Decoupled Storage]
Architecture Component Legend & Technical Role:
1. Stateless Gateways (Left Block): Handles user authentication, SSO SAML/OIDC tokens, and OData REST API routing. Because it is completely stateless, user logins never compete with cube calculation threads.
2. TM1 Calculation Engine (Center Block): The high-performance in-memory OLAP core. Cubes, rules, and feeders run in isolated calculation pods. Organizations can scale multiple active read replicas to serve peak budget cycles without duplicating physical hardware.
3. Cloud Persistence Layer (Right Block): Decoupled cloud object storage executing continuous background snapshots. Reboots take seconds instead of 45-minute cold loads because memory states are restored instantly.

The core calculation engine remains an ultra-fast in-memory OLAP database, but the infrastructure surrounding it has been completely modernized into discrete services:

  • High Availability and Multi-Replica Databases: Engine 12 treats databases as managed cloud services. You can deploy active replicas that scale compute resources dynamically based on peak forecasting demands without duplicating physical hardware.
  • Automated Directory Creation and File Handling: Functions like TextOutput and AsciiOutput now create target directory structures automatically on cloud object storage. Developers no longer need to write manual OS directory creation routines.
  • REST-Native Automation with ExecuteHTTPRequest: Direct operating system command execution (ExecuteCommand) is retired in Engine 12 for enterprise security. In its place, TI processes use ExecuteHTTPRequest to communicate with external APIs, Azure Logic Apps, Power Automate, or serverless microservices. This eliminates the custom glue code friction we analyzed in Why Enterprise AI Projects Stall on API Glue Code.

3. The Retirement of Legacy 32-Bit Tooling

Moving to Engine 12 marks the official end of legacy client applications that have supported TM1 developers for decades:

  • Retired Tools: TM1 Architect, TM1 Perspectives (Excel Add-in), Performance Modeler, and TM1 Applications Web.
  • Planning Analytics Workspace (PAW): The central web-based interface for all modeling, cube authoring, rule editing, process configuration, and dashboard design. To get the most from PAW modeling, see our deep-dives on Mastering MDX in Planning Analytics Workspace and Selector Tiles in PAW.
  • Planning Analytics for Microsoft Excel (PAfE): The high-performance, modern 64-bit Excel add-in utilizing REST API endpoints for dynamic exploration and reporting.
  • Enterprise BI Integration: For teams connecting live TM1 cubes directly to executive dashboards, solutions like Datafusion for Real-Time Power BI Integration provide direct, high-speed reporting pipelines without manual data exports.
Figure 2: Planning Analytics Workspace (PAW) Unified Modeling & Reporting Interface
Cube Analysis & MDX View Builder Rows: Entity / Cost Center Columns: Period / Actual Live In-Memory Write-Back Grid Real-time dynamic rule calculation & sandbox modeling Executive Financial Dashboards Actuals vs. Forecast Visualizations • Instant consolidated variance reporting • Direct TM1 cube connection (Zero ETL latency) • Multi-chart synchronized drill-down FINANCIAL WORKFLOW & GOVERNANCE STATUS PIPELINE 1. Data Collection [Done] 2. FP&A Review [Active] 3. CFO Approval [Pending] 4. Month-End Lock [Pending]
Workspace UI Component Legend & Technical Role:
• Cube Analysis Grid (Left Section): Web-based cube view designer allowing FP&A analysts to slice multi-dimensional models, create sandboxes, and perform instant write-back without installing desktop client software.
• Financial Dashboards (Right Section): Real-time executive visualizations pulling consolidated actuals vs. budget variances directly from TM1 rules in milliseconds.
• Workflow & Governance Pipeline (Bottom Section): Replaces legacy TM1 Applications Web with end-to-end task assignment, multi-tier approvals, and audit trail locking across cost centers.

By centralizing development in PAW, teams eliminate client-side installation overhead and ensure every modeler accesses the exact same governance rules.

Traditional TM1 (V11) vs. Planning Analytics Engine 12 (V12)

Architectural Dimension Traditional TM1 (Version 11) Engine 12 (Planning Analytics 3.1)
Deployment Model Monolithic on-premises / IaaS VM Cloud-Native containerized microservices
Server Startup Full memory reload (20 to 60 minutes) Fast container spin-up with managed persistence
High Availability Manual standby clustering or cold backup Automated multi-replica service failover
External Automation Local ExecuteCommand (batch / PowerShell) Secure ExecuteHTTPRequest REST endpoints
Client Modeling TM1 Architect & Perspectives (32-bit) Planning Analytics Workspace (PAW) & PAfE
File Management Requires manual server-side file directories Automatic directory generation in cloud storage
Support Status PA 2.0.9 standard support ended Oct 2025 Modern platform with continuous release stream

4. The 2026 TM1 Modernization Playbook

Upgrading to Engine 12 is not just a version bump; it is an infrastructure upgrade that streamlines ongoing administration. Here is how enterprise planning teams are executing their transition:

1
Audit TI Scripts for ExecuteCommand

Catalog all TurboIntegrator processes that call external operating system batch files. Convert file movements and email alerts to REST endpoints using ExecuteHTTPRequest and modern webhooks.

2
Transition Modelers to PAW and PAfE

Phase out TM1 Architect and Perspectives immediately. Ensure your finance and modeling teams are comfortable building dimensions, rules, and reports directly in Planning Analytics Workspace and Excel.

3
Review MDX Queries and Rules

Engine 12 uses a modernized, standards-compliant MDX calculation parser. Validate custom MDX queries to ensure compatibility and take advantage of new memory management guardrails.

4
Establish Cloud or Container Migration Path

Determine whether your organization will deploy via IBM Planning Analytics as a Service (SaaS) or IBM Cloud Pak for Data on OpenShift before the October 2026 extended support cutoff.

Frequently Asked Questions

What is the deadline to upgrade from IBM Planning Analytics 2.0.9?

Standard support for IBM Planning Analytics 2.0.9 ended on October 31, 2025. Extended support runs until October 31, 2026. Organizations should migrate to Planning Analytics 2.1 or Planning Analytics 3.1 (Engine 12) before this date to ensure ongoing vendor patches and security compliance.

Can I run TurboIntegrator processes with ExecuteCommand in Engine 12?

No. ExecuteCommand is disabled in Engine 12 for cloud security. All external automations must be migrated to ExecuteHTTPRequest to call REST endpoints, serverless functions, or cloud integration platforms.

How does Engine 12 improve database recovery and server restarts?

Engine 12 decouples compute from storage and uses cloud-native object snapshotting. Database instances spin up in seconds rather than requiring 45-minute disk loads and feeder calculations.

The Leadership Takeaway

IBM Planning Analytics Engine 12 preserves what made TM1 world-class—its calculation speed and multi-dimensional modeling flexibility—while replacing the operational headaches of a 30-year-old server monolith.

By adopting cloud-native microservices, automated file handling, and REST-based integration, finance organizations can build scalable planning applications that require less maintenance and deliver faster insights.

Planning Your TM1 Modernization to Engine 12?

Octane Solutions helps enterprise FP&A and finance technology teams audit legacy TI processes, re-architect feeders, and execute zero-downtime migrations.

Schedule an Architectural Assessment
Line

Unlocking the power of IBM Planning Analytics with execute HTTP request

Mode_Comment_Icon_black0
Alarm_Icon_14 min

Today, we’re excited to explore a game-changing function that enhances the versatility of your Planning Analytics platform. Imagine a tool that not only streamlines your data processes but also connects your Planning Analytics seamlessly with external systems. This innovation allows you to execute HTTP requests directly within your TurboIntegrator (TI) processes, transforming your Planning Analytics into an integral part of your interconnected ecosystem. Join us as we delve into the possibilities this function brings and how it can elevate your data management strategies to new heights.

Image

Why Execute HTTP Request is a Game-Changer

What makes this function truly versatile is its ability to connect with any external system that supports APIs. The only limit is your imagination and the capabilities of the APIs you wish to connect to. Integrating Planning Analytics with external systems allows developers to break free from traditional limitations and extend the functionality of their applications.

This session will include practical demonstrations of several use cases that highlight the power of the Execute HTTP Request. By the end, I hope to inspire you to explore how you can leverage this function to enhance your TM1 applications and workflows.

Demo 1: Hot Promotion of Objects Between Instances

Let's dive into our first demonstration on how to perform hot promotion of objects from one instance to another. Traditionally, migrating objects between instances involved shutting down the target server. However, using the Execute HTTP Request, we can do this in real-time.

  1. Setting Up the TI Process:
     
    • Open the workbench in your workspace and create a new TI process.
    • Declare necessary constants and set your source and target instances (e.g., SmartCo to Demo Server).
  2. Use of HTTP Execute Request:
     
    • Fetch dimensions from the source instance and check for their existence in the target instance.
    • For non-existing dimensions, save them as JSON files and use the HTTP Execute Request to migrate them to the target instance.

Let’s execute this process! Once completed, you’ll see that the dimensions have been successfully migrated.

Demo 2: Executing a Process Across Instances

Next, we'll demonstrate the ability to execute a process from one instance in another:

  1. Migrate TI Processes:
     
    • Similar to dimension migration, retrieve the TI process (like Sample TI) from the source instance and save it as a JSON file.
  2. Execute the TI Process:
     
    • Use the Execute HTTP Request to trigger execution from the target instance while utilising its response to capture status codes and log outputs.

After running this process, you should see that both the processes have been migrated and executed successfully.

Demo 3: Loading Currency Conversion Rates

In this demo, we will load real-time currency conversion rates from a website using its API:

  1. Call the API:
     
    • Set up an HTTP GET request to retrieve USD conversion rates.
  2. Extract and Utilise Data:
     
    • Capture the JSON response and extract required currency rates using JSON functions.

image (2)-1

Run the process, and you will observe the real-time conversion rates being fetched and displayed.

Demo 4: Sending Teams Notifications

Next, I’ll show you how to send automated notifications to Microsoft Teams:

  1. Integrate with Microsoft Power Automate:
     
    • Set up a Power Automate flow to send notifications.
  2. Trigger Notification from System:
     
    • Use Execute HTTP Request to trigger alerts in Teams based on process execution results.

image-Feb-05-2025-07-23-13-1010-AM

After execution, you should see notifications appear in your Teams channel.

Demo 5: Sending Emails via HTTP Requests

Finally, we'll explore how to send emails:

  1. Power Automate for Email Notifications:
     
    • Again, set up Power Automate to manage email sending through appropriate HTTP requests.
  2. Dynamic Email Content:
     
    • Utilise dynamic fields for subject and body based on execution results.

After executing this process, you will receive the email in your mailbox.

Conclusion

Today, we have unlocked the extensive capabilities of the Execute HTTP Request function in IBM Planning Analytics. We showcased hot promotion between instances, cross-instance process execution, real-time data fetching, as well as integration with Microsoft Teams and email notifications. 

Thank you all for attending this session. I hope you found it beneficial and feel inspired to explore the functionality of Planning Analytics further. Let’s move toward a more integrated and dynamic future in our analytics processes!

Line

Enhancing Planning Analytics Workspace (PAW) visualisations using MDX

Mode_Comment_Icon_black0
Alarm_Icon_15 min

Planning Analytics Workspace (PAW) offers a robust suite of visualizations, enabling users to create rich and compelling reports and dashboards with remarkable flexibility. However, even with these capabilities, you may occasionally encounter requirements that push the limits of what PAW provides out of the box. 

One such scenario I encountered was the need to create a column chart comparing Actual vs Budget variance. The twist? Any negative variance should be highlighted with a red bar, while positive variance should be displayed in green, as shown below: 

A screenshot of a computer screen
Description automatically generated

PAW’s default settings don't currently offer this kind of custom conditional formatting for visualizations. However, with a little MDX magic and a few formatting tweaks, you can achieve this effect in just five simple steps. 

Step-by-Step Guide to Creating Custom Visualizations in PAW 

Step 1: Position the Version Dimension in the Column 

Start by positioning the Version dimension in the column of the Exploration view. This is where we will apply the MDX logic to derive the desired results. 

Step 2: Use MDX to Create Calculated Members 

Next, you'll need to update the MDX query by creating three calculated members to represent Actual vs Budget (AvB), Positive Variance, and Negative Variance. 

Here’s the MDX code: 

MDX code: 

WITH  

MEMBER [Version].[Version].[AvB] AS [Version].[Version].[Actual] - [Version].[Version].[Budget]  

MEMBER [Version].[Version].[Positive] AS IIF([Version].[Version].[AvB] > 0, [Version].[Version].[AvB], "") 

MEMBER [Version].[Version].[Negative] AS IIF([Version].[Version].[AvB] < 0, [Version].[Version].[AvB], "") 

Note: The AvB calculation could also be done using a consolidated member in the Version dimension, where the Budget has a negative weight. 

Step 3: Replace the MDX in the Row Axes 

Now, replace the MDX in the Row Axes relating to the Version dimension to show only the Positive and Negative calculated members, while excluding the AvB calculation (and any other member): 

MDX code: 

    EXCEPT( 

        { 

            [Version].[Version].[AvB], 

            [Version].[Version].[Positive], 

            [Version].[Version].[Negative] 

        },  

        { 

            [Version].[Version].[AvB] 

        },  

        ALL 

    ) 

This MDX will generate a view that displays only Positive and Negative members in the Version dimension, leaving the non-relevant member (whether positive or negative) as blank, depending on the AvB value. 

Step 4: Convert the Exploration View into a Column Chart

Once the MDX has been applied, convert the Exploration view into a Column Chart. By default, PAW will show the columns for positive and negative values with its standard color scheme.  

A graph of a number of states
Description automatically generated


Step 5: Apply a Custom Color Palette 

To finalize the visualization, we’ll apply a custom color palette. Navigate to the visualization properties and create a color palette that includes only two colors: green for positive values and red for negative values. 

A blue and white flag
Description automatically generated with medium confidence

Conclusion 

With just a few lines of MDX and a bit of customization, you can significantly enhance PAW visualizations. This technique allows you to move beyond the standard out-of-the-box options, giving you the flexibility to create more intuitive and visually effective reports. Whether you're comparing Actual vs Budget or any other metrics, these methods help you build visuals that not only convey the necessary information but do so in a way that is easy to interpret at a glance. 

By leveraging MDX and PAW’s formatting tools, you can push the boundaries of your reporting and create dynamic, insightful dashboards tailored to your business needs. 


Line

Planning Analytics Workspace Local Distributed

Mode_Comment_Icon_black0
Alarm_Icon_12 min

PAW Local Distributed is an upgrade to Planning Analytics Local Workspace that can be deployed in a container orchestration engine using either Docker Swarm by Docker or Kubernetes - an open source by Google, for high availability, fail-over, scalability, and fault tolerance in multiple application servers or virtual or even cloud machines.

Architecture:


AMIN1


The Planning Analytics Workspace Distributed is run on a Swarm mode by deploying the application on multiple Docker nodes (with unique node ids) also known as Swarm.


Docker Engine CLI could be used to create a swarm and deploy and manage the application services in swarm.

Swarm mode ensures secured connection across multiple servers. Additionally, some of the key features that Swarm mode offers includes:

Cluster management integrated with Docker Engine,

Declarative service model,

Desired state reconciliation,

Horizontal Scaling and Load Balancing,

Multi-host networking,

Automatic service discovery,

Service Discovery,

Rolling updates with roll-back


AMIN2


The Docker engine maintains high availability by effectively scheduling the failed node’s task to other nodes.

It was released in 2.0.41 version of Planning Analytics Workspace and is available to be downloaded from IBM Fix Centre from below link.

https://www-945.ibm.com/support/fixcentral/swg/selectFixes?product=ibm%2FInformation+Management%2FIBM+Planning+Analytics+Local&fixids=BA-PAWL-2.0.41&source=dbluesearch&function=fixId&parent=Analytics%20Solutions

Note: The Docker Swarm is currently supported on Red Hat Enterprise Linux (RHEL) only.

The Docker Enterprise Edition for RHEL could be downloaded from the following link:

https://docs.docker.com/install/linux/docker-ee/rhel/


Line

PAX and PAW 2.0.41

Mode_Comment_Icon_black0
Alarm_Icon_13 min

What's interesting to note is that Planning Analytics Workspace (PAW) version 2.0.40 and 2.0.41 are combined so that the release of Planning Analytics Workspace 2.0.41 aligns with the IBM Planning Analytics for Microsoft Excel (PAX) release.

IBM-planning-analytics-1


With several fixes applied to both PAW and PAX in this version; this post will focus more on the enhancements and features. However, should you want to review the fixes, you can find those here.

Features:

With this release, you will now be able to create and edit drill through rules and processes in Workspace.


paw_2


Also finding users who don't have any permissions is quick and straightforward by using the new menu.


paw_search_levels2


A new quality of life enhancement is that grid refreshes can be configured to automatically refresh on new views when it's n level data changes.


paw_3


Database configuration parameters are now set from the database activity report.


paw_4


With this other metrics such as threads blocked will also now appear on the database activity report.


paw_5


The set editor allows you to now define which levels of a hierarchy to include in a report with dynamic ranges.These can be defined as Level >= level002.


paw_search_levels2-1


There are individual icons for dynamic and static sets helping determine whats dynamic in the hierarchy and what is not.


paw_6


Planning Analytics Workspace can now be Distributed on Docker Swarm but currently supported on Red Hat Enterprise Linux only.

You can use Constrained Calculations in PAX to narrow the scope of the recalculates to just your active worksheet; Increasing the performance and speed of the worksheet.

Whilst this covers the main features; there is plenty more to read, follow this link to IBM for more.


Line

Unraveling TM1 : Lesser Known Facets – Part B

Mode_Comment_Icon_black0
Alarm_Icon_17 min

Thank you if you have come back for more! Hope our last blog Unraveling TM1 : Lesser Known Facets – Part A was meaningful. In this part we will unearth & explore few more of these lesser known gems.

As always, if you like what we do and want to associate; subscribe to our Blogs at http://blog.octanesolutions.com.au


Function TM1RPTROW

We know TM1RPTROW is a salient function when building demand and rolling forecasts in Planning and Budgeting models

Although everyone is aware of the fact that parameters like Dimension Subset, MDX Expressions are a part of TM1RPTROW, developers tend to assume the following features are either hard to achieve or are time consuming.

TIP 4. Search Functionality on the elements of TM1RPTROW

Subset elements can be filtered by wildcard search in Subset editor; we all now this. Similar approach has been used to look for an element in websheets.

As an alternative to subsets in TM1RPTROW, let’s look into another parameter which serves the purpose - MDX

Syntax: TM1RptRow(ReportView, Dimension, Subset, SubsetElements, Alias, ExpandAbove,MDXStatement, Indentations, ConsolidationDrilling)

S1(1)

As an illustration, consider a TM1 Websheet created to understand how it could be done.

As shown in the screenshot below, a search option has been provided with for a model from the view.


Create the MDX expression which is to be referred in a cell as illustrated below

S2

In the screen shot, MDX (Cell I11) is getting filtered based on the data provided in cell E19.

This is when the MDX parameter of TM1RPTROW must be updated to refer to the Cell I17(named as sLMDX) as shown in screenshot below.

S3

It can be seen that MDX Parameter is updated to refer the MDX expression only if search cell has some value and not when null (in the case as TM1RPTROW functionality Subset will take precedence)

Resulting a view as per the search expression; Provide a wildcard expression (which is supported in TM1) and refresh the sheet.

View will be refreshed with data for only the searched elements as shown below. Thereby delivering the purpose.

S4


TIP 5. Switching between two different views in TM1 Web

Though not a requisite to have to switch between 2 different views, there comes times and a business need which may require you to deliver different views.

Consider an Example of standard IBM model Salescube in Sdata Instance.

In Model Dimension of SalesCube, we have model elements S Series, L Series and T Series. User Case: ‘S Series’ and ‘T Series’ model (in this case being car models) need to be forecasted/Budgeted for future years based on the actuals of L Series.

S5

To accomplish this, the Web screen should show ‘L Series’ as selected actuals and ‘T Series’, ‘S series’ for Forecast/Budget version.

For illustration purpose, consider the TM1 Websheet below…

As we know by now, TM1RPTROW has a parameter to provide Dimension Subset.

We will create 3 subsets which has L Series elements, T-Series & S-Series elements respectively

S6


Definitely not as complicated as it may sound, When actual is selected:

S7

From the screenshot, it is clear that when “actvsbud” is changed from Actual to any other Version, the view of a websheet will change (as specified in TM1RPTROW) once refreshed. Developers can use Nested IF, if the requirement is to have different view sets for each selection in the dimension.

Refreshing the websheet results in (refer image below);

S8-2

TIP 6. Locking rows to restrict user entry

Think SECURITY; there would be scenarios when users are provided with view access only into TM1 Web applications.

While security is good and essential, there would be times when the underlying cube has huge volumes of data and applying cell security may result in performance issues.

While formatting (locking the cells/row of a particular measure) in excel is an option, formatting an area in TM1 active form can be used extensively to avoid cell security.

Consider an example (refer fig below), the need is 1.6 Series to be non-editable.

Using excel ‘IsNumber’ and ‘search’ function look for 1.6 in the TM1RPTROW elements (as shown in the below screenshot). Name the row as L to setup formatting in format area of active form.

S9 

Insert a row in the format area and name the row as L as shown below.

S10 

Format colour as user’s requirement and lock the cells as shown below.

S11 

Hide rows and columns within active forms which are not meant for users, protect the sheet in review tab as shown below.

S12 

Hope you would have enjoyed reading this blog as much as I had testing these cool features; so until next time, keep planning on IBM Planning Analytics!

You may also like reading:

What is IBM Planning Analytics Local

IBM TM1 10.2 vs IBM Planning Analytics

All you need to know about Planning Analytics 2.0.5

Little known TM1 Feature - Ad hoc Consolidations

IBM PA Workspace Installation & Benefits for Windows 2016

101 Guide to Blockchain

TI Optimisation – An Epilogue

To Subscribe, visit http://blog.octanesolutions.com.au


For more Information: To check on your existing Planning Analytics (TM1) entitlements and understand “how to”, reach out to us at info@octanesolutions.com.au

Octane Software Solutions is an IBM Registered Business Partner specializing in Corporate Performance Management and Business Intelligence. We provide our clients advice on best practices and help scale up applications to optimise their return on investment. Our key services include Consulting, Delivery, Support and Training.

Octane has its head office in Sydney, Australia as well as offices in Canberra, Bangalore, Gurgaon, Mumbai, and Hyderabad.

To know more about us visit, OctaneSoftwareSolutions.


Line

Unraveling TM1 : Lesser Known Facets – Part A

Mode_Comment_Icon_black0
Alarm_Icon_16 min

No matter how much we think we know about TM1, there are always these set of conditions that make you think “what-if there was a better way”??!! For example, not having to write a bunch of codes just to delete the subsets after using it in a Source View Or not writing the same area definition twice. What-if this could be done with less or no coding at all!

This blog and its subsequent part will focus on showcasing few of such many lesser known features in TM1. These little tricks and tips are a step towards better code management and of course peace of mind.


TIP 1. One area definition for two different rules at N and C level

Let’s take an example of Headcount in an Employee (HR Data) cube.

  • Headcount is calculated monthly based on on-roll employee count in a particular month.
  • However, if we pan-out at an All Months level (as illustrated in the figure below), total headcount adds up from Jan to Dec, which is not a true representation of employee count.

J1-1

  • Correcting this needs a rule to be written at a consolidated level which will pick the headcount from Dec.
  • Instead of writing a separate line of rule with same Area definition, different rules can be clubbed and written for both N and C level separated by a semicolon (as illustrated in the figure below).

J2


TIP 2. Error file directory

On any given day, you would hardcode the directory path or fetch it from a cube where the path is stored, this to ensure dynamism and to address issues with regards to data movement from one server to another.

But if you are not using this cube often or for any other purpose, it soon becomes redundant. There is a work around in which use of GetProcessErrorDirectory function offers the path and allows you to log into directory of respective server instances.

A folder inside logging can be created (as illustrated in the example below) and the file directed to that path, so even if/when the code is moved to different server/instance, it still works seamlessly.

Code snippet shows the use of function:

J3

Exporting the exception to the file:

J4

Output file:

J5

TIP 3. Temporary Subset and Views

 In Turbo Integrator (TI), to process a cube view, it is a good practise to delete view and subsets created in Prolog to reduce redundancy. This is commonly done in Epilog tab of process using various functions.

But there is a much simpler way to delete views and subsets without the need of writing code in Epilog.

The screenshot below illustrates a code snippet, highlighted portion is the secret recipe; Adding “1” as the third parameter to functions ViewCreate, SubsetCreate or SubsetCreatebyMDX considers the views and subsets as temporary and deletes them once the process is completed.

This improves overall performance as deleted temporary objects can’t create lock, as a result of which TI doesn’t need to wait for locks to be released before executing a temporary object.

J6

Note: These functions are available from 10.2.2 FP4 onwards.


Hope you would have enjoyed reading this blog as much as I had testing these cool features; stay tuned for Part B of this blog series on Lesser Known Facets of TM1. To Subscribe, visit http://blog.octanesolutions.com.au

You may also like reading: 

What is IBM Planning Analytics Local

IBM TM1 10.2 vs IBM Planning Analytics

All you need to know about Planning Analytics 2.0.5

Little known TM1 Feature - Ad hoc Consolidations

IBM PA Workspace Installation & Benefits for Windows 2016

101 Guide to Blockchain

TI Optimisation – An Epilogue


For more Information: To check on your existing Planning Analytics (TM1) entitlements and understand “how to”, reach out to us at info@octanesolutions.com.au

Octane Software Solutions is an IBM Registered Business Partner specializing in Corporate Performance Management and Business Intelligence. We provide our clients advice on best practices and help scale up applications to optimise their return on investment. Our key services include Consulting, Delivery, Support and Training.

Octane has its head office in Sydney, Australia as well as offices in Canberra, Bangalore, Gurgaon, Mumbai, and Hyderabad.

To know more about us visit, OctaneSoftwareSolutions.

Line

Caveat Around Concurrent Data Loads - Part B

Mode_Comment_Icon_black0
Alarm_Icon_14 min

Welcome back, for those who had read Part A of this blog, hope you would have tested Parallel Interaction and benefitted from it. For those who haven’t, you can read it at http://blog.octanesolutions.com.au/caveat-around-concurrent-data-loads-part-a

This blog builds upon the previous one and focusses on improving performance by Parallel Interaction, it highlights TM1 facets worth consideration while an object is locking.


Synopsys

Tips towards improvements around support for concurrent read/write and/or parallel execution of turbo integrator process enabling higher efficiencies and productivity.


Analysis

  • Declare unique view and subset names

This allows to run a Turbo Integrator process without locking when executed by concurrent users simultaneously.


  • Establish Cube Dependency

This nullifies the chance of a query or process triggering a cube dependency; this usually happens during periods of user activity that may block objects and cause contention issues for concurrent reads and writes.

To establish a cube dependency, include AddCubeDependency function and valid only in the Turbo Integrator process. This function creates a manual dependency between two cubes in the model.

Syntax: AddCubeDependency('CubeA','CubeB');

Argument

Description

CubeA

The name of the base cube.

CubeB

The name of the dependent cube.

Cube B relies on a rule that is dependent on Cube A.


  • Use a ViewConstruct function in Turbo Integrator processes

This will increase the speed of Turbo Integrator process as it stores a stargate view in memory on the server. The purpose of ViewConstruct function is to cache the view by pre-calculating and storing large views for quick retrieval post a data load or update.

Syntax: ViewConstruct(CubeName, ViewName);

Argument

Description

CubeName

The cube from which you want to construct the view.

ViewName

The view you want to construct. This view must be an existing public view on the server.


  • Dimension Maintenance (or Dimension read/write)

This places locks on read and write operations in any cube that includes dimension updates. Thrashing may result in locks during dimension maintenance (read/write to dimensions) as part of executing the Turbo Integrator process.

Note: Do not include dimension maintenance as part of data upload or updates.


  • Maintaining an Attribute (Alias)

This again places locks on read and write in any cube that includes dimension updates.

Thrashing may result in locks during dimension maintenance (read/write to dimensions) as part of executing the Turbo Integrator process.

Note: Do not include attribute alias maintenance as part of data upload or updates.


For more Information: To check on your existing Planning Analytics (TM1) entitlements and understand “how to”, reach out to us at info@octanesolutions.com.au.

Octane Software Solutions Pty Ltd is an IBM Registered Business Partner specializing in Corporate Performance Management and Business Intelligence. We provide our clients advice on best practices and help scale up applications to optimise their return on investment. Our key services include Consulting, Delivery, Support and Training.

Octane has its head office in Sydney, Australia as well as offices in Canberra, Bangalore, Gurgaon, Mumbai, and Hyderabad.

Get a free one-hour consultation on us

To know more about us visit, OctaneSoftwareSolutions.

Line

Sandbox Analysis. Delivered

Mode_Comment_Icon_black0
Alarm_Icon_15 min

In this blog, would like to introduce you to a new feature called "Compare Sandboxes"; this feature, an extension to Planning Analytics Workspace’s existing capability, shall be available both on Cloud and in Local versions.


What is a Sandbox? (Jump to “Feature Explained” section if you are an existing TM1 user & know this well)

A Sandbox lets you create your own personal workspace, your own version where you can enter & store data-value-changes without impacting the base (actual) data. 

  • A sandbox is not a copy of the base data, but a separate overlay or a layer of your own data values that you have entered on top of the base data.
  • Sandboxed data is your own personal work area, its private to each user and cannot be seen by others.
  • Once a sandbox is created, user can run multiple iterations on the data set without effecting the base data.
  • When user commits the sandboxed data back into the base data, the changed values are then visible to others.
  • Sandbox help user explore different business scenarios, for example, user may create best case, average case, worst case.


So, What’s new??

While “sandboxing” has been around for some while now, users have been asking (almost demanding) for a “Compare Sandbox” feature.  This in essence is the possibility of comparing different scenarios (like best vs average vs worst) to help users analyse and drive better business decisions. This would also help streamline scenarios well before they are committed in the system.


Feature Explained:

As we now know, earlier versions of Planning Analytics (TM1) did not have an option where in users could compare different sandboxes, Now, users with entitlements to Planning Analytics Workspace (PAW) licenses can not only create personal scenarios in sandboxes but also view them side-by-side to compare and analyse the cause & its effect.

This was made possible as PAW considers Sandbox names as elements of dimension called Sandboxes (refer fig 1).

Figure 1Picture1


For illustration, you can now display your Best & Worst case sandbox scenarios next to each other in nested columns, and then, calculate the variance, as shown below. 

In this example, we have two sandboxes Sri_BCase and Sri_WCase.

In Figure 2 Sandboxes are same as base data. BCase-WCase is on-fly calculation which gives variance between Sri_BCase and Sri_WCase.       

Figure 2 

Picture2


In Figure 3 Sandbox Sri_BCase, budgeted Units for S Series 2WD for world has been increased by 3%, Sri_WCase still holds base data. We can now see variance between Sandboxes in below figure.

Figure 3

Picture3

In Figure 4 Sandbox Sri_WCase, budgeted Units for S Series 2WD for world has been increased by 0.5%, Sri_BCase holds 5% increased data earlier. We can now see variance between Sandboxes.

Figure 4

Picture4

In Figure 5 this data can also be visualized using different graphs with in PAW. In this case Stack Bar has been used to Visualise data.

Figure 5

Picture5


In Figure 6, we can also visualise the impact of these changes on other values like Sales, Price and other related measures.

Figure 6

Picture6

What would I like to see more

  • Capability to spread data across multiple sandboxes.
  • Capability to add members (new versions) to the Sandboxes dimension unlike the traditional way.


Frequent Feature refresh from IBM:

As a part of its continuous improvement program, IBM basis its Client's business requirement and requests has been adding features to PA Workspace. IBM published "Compare Sandboxes" feature in PA Workspace in its version 2.0.31 release. Some of the features from earlier versions are Create Virtual Dimensions on fly, Calculation on the fly, Sorting, Ranking etc.

Hope you would have enjoyed reading this blog as much as I had testing this cool feature; stay tuned for upcoming blogs.


You may also like reading “ What is IBM Planning Analytics Local ” , “IBM TM1 10.2 vs IBM Planning Analytics”, “Little known TM1 Feature - Ad hoc Consolidations”, “IBM PA Workspace Installation & Benefits for Windows 2016”.


For more Information: To check on your existing Planning Analytics (TM1) entitlements and understand how to upgrade to Planning Analytics Workspace (PAW) reach out to us at info@octanesolutions.com.au for further assistance.

Octane Software Solutions Pty Ltd is an IBM Registered Business Partner specialising in Corporate Performance Management and Business Intelligence. We provide our clients advice on best practices and help scale up applications to optimise their return on investment. Our key services include Consulting, Delivery, Support and Training.

Octane has its head office in Sydney, Australia as well as offices in Canberra, Bangalore, Gurgaon, Mumbai, and Hyderabad.

To know more about us visit, OctaneSoftwareSolutions.

Learn how to create Sandbox via PAW

Line

IBM PA Workspace Installation & Benefits for Windows 2016

Mode_Comment_Icon_black0
Alarm_Icon_18 min

In this weeks blog, our team make it our duty to shine some light on right tool your company can choose to meet your business needs. We will cover the much discussed benefits of installing and using IBM's Planning Analytics workspace on Windows 2016.

Contents
    1. What is PA and PAW
    2. PAW and Windows 2016
    3. Benefits on PAW on Windows 2016


What is PA and PAW?

IBM_PA_Questions

Planning Analytics ("PA") is the next version, or can be considered as the next generation of TM1. IBM enhanced TM1 functionality and features and embraced new tools to its' suite. This new enhanced TM1 has been rebranded as PA. IBMs PA has the best of BI, Watson, planning and analytic engines under one solution. 

IBM Cognos TM1 which required trendy data presentation and visualization capability – a demand from Clients - has now been fulfilled by IBM. IBM has embedded Workspace to Planning Analytics, which is now called Planning Analytics Workspace ("PAW"). The below diagram gives a high level picture of new Architecture.

The following diagram shows where PAW fits into your IBM PA Local architecture:

Planning_Analytics_Workspace_LAN


IBM PA Workspace

As a new face of the Cognos TM1/IBM Planning Analytics solution, IBM's PAW delivers a rich, interactive user interface where you can easily build analytical and planning applications or dashboards by combining cube views, web sheets, scorecards, and data visualizations. It is flexible enough to export to excel and publish the same data to workspace. And, you can now create dynamic reports via active forms for planning and budgeting, and gain insight and discovery via data visualisations from a very clean UX workspace and dashboard – even easily share content, reports and dashboards between users. 

Highly Clean and Visual View-Based Interface: The interface is a highly visual, freeform design with over 25 charts, scorecards, images, shapes and many other options. You can easily synchronize data between different objects (cube views, web sheets etc.)

On Premise and On Cloud: An amazing innovation is Planning Analytics Workspace (PAW) and its two variants. One, being on premise called Local. And the other, is cloud based referred as on Cloud.

It is a data rich tool, that can show data from all different cubes, to meet business needs: PAW is also view-based, which means you can import multi-dimensional data into a workspace and then it effectively converts and displays it as a chart to map your visualisations (whether it is a bar graph, scatter graph, line graph or so forth).

Easily share between hundreds of users: PAW is a highly interactive viewer that makes it easy to swap data exploration to charts. The main advantage of a drag and drop workspace, unlike some other platforms that require you to write the rule for reports yourself, is that business users can easily build and share their own reports and dashboards.

Support Analysis, Reporting and Write-back features: So for example if you require write-back or what-if analysis of data, or need the aggregate data from high-volatility APPs in real-time, users can benefit from PAs consistent performance and tightly controlled latency of cached and non-cached data.

Mobile Compatibility: Workspace is mobile and can be accessed from tablets and iPads! Aside from supporting all your web interfaces such as Chrome, Safari, Explorer and Mozilla, you can even access work on the go from meeting to meeting, with mobile compatibility access. This full service analytics solution supports faster loading and scrolling for both web and cloud interfaces that enables high performance across WAN wireless access networks, and has iPad mobile compatibility.

Fast Querying and Loading Time: A T1 debugger in PA now uses a TM1 server as part of the back end. This means whether you are on a web browser or cloud interface there are less latencies and errors in querying, building or visualising reports, as opposed to traditional BI engines. Loading time is two (2) to four (4) times faster.

PAW comes with the above features and more such as combing additional highly versatile visualization features.

What makes your additional visualisation plugins unique with IBM PAW is that it does not require additional add-on licenses!


PAW Installation

On the other hand, the installation of PAW is not as smooth sailing as a TM1 or Cognos BI installation. PAW needs an additional software called Docker to be setup before installing PAW. Once docker is installed and ready to use, the next step is PAW installation.

The following diagram shows where Planning Analytics Workspace fits into your IBM Planning Analytics Local architecture:


Installation Workflow

4_steps_to_installing_IBM_Planning_Analytics_Workspace

Though the installation process looks simple, this needs technical manual assistance to fix issues and make installation and configuration a success.

If not all TM1 Experts, at least 98% of technical consultants who would have tried to upgrade from TM1 to PA, whilst installing PAW, would have encountered below error. 

PAW_Error

Fixing this issue may cause delay in upgrading your system. It may also incur costs to fix this issues in non-prod environment. Once the non-prod is fixed, an outage or planned reboot, as well as BIOS changes are musts to fix the prod environment.


Benefits of PAW on Windows 2016

PAW for Windows 2016 has been available since June 2, 2017 ( 2.0.21).

Let us consider your clients business objectives for a second. Your companies strategy and technolocy benefits from embacing business intelligence trends that has been made available via systems such as the new PAW package support for Windows 2016 OS.

Again, docker is a must for getting PAW installed and configured on Windows 2016. The docker used here is not a native docker but a different docker called docker EE. 


What’s the Gain with PAW for Windows 2016 OS?

Microsoft has come long way with confounding features. The most versatile features, we would say, are:

  • Nano Server: A Nano Server boasts a 92 percent smaller installation footprint than the Windows Server graphical user interface (GUI) installation option.
  • Containers: Docker-based containers to Windows Server.
  • Linux Secure Boot: Deploy Linux VMs under Windows Server 2016 Hyper-V with no trouble without having to disable the otherwise stellar Secure Boot feature.
  • Storage Replica and ReFS: ReFS is intended as a high-performance, high-resiliency file system intended for use with Storage Spaces Direct and Hyper-V workloads.
  • Storage Spaces Direct: More affordable for administrators to create redundant and flexible disk storage.
  • Nested Virtualization: Nested virtualization refers to the capability of a virtual machine to itself host virtual machine. Nested virtualization makes sense when a business wants to deploy additional Hyper-V hosts and needs to minimize hardware costs.
  • Hyper-V Hot-Add Virtual Hardware: We can now "hot add" virtual hardware while VMs are online and running.


Gain for PA and PAW Administrators

  • The first and foremost advantage is that there is no need to have a Virtualize active in VMWARE.
  • As there is no need to activate Virtualization, physical server is not required instead a VM can be used for the PAW. Thus reducing not just the cost involved with money but also the time and effort must be counted.
  • Embracing new Windows OS with new features means that you can be rest assured in regards to the performance and availability of PAW – which was not the case with TM1 10x.
  • Storage Replica is an amazing feature in Windows 2016, this helps during failovers and quit turnaround at critical times.
  • All leading to reduced expenses.


Contact one of Octane Software Solutions specialists for an upgrade made easy today!


IBM_Value_Matrix 

Planning Analytics is one of the reasons that makes IBM a market leader performance management quadrant.

  • We are experts in this Cognos TM1 technology, having extensive experience in upgrading TM1 from older versions to newer Versions.
  • Migrated our client’s system from IBM TM1 9x and 10x versions to new trending technology called Planning Analytics TM1.
  • Installed Planning Analytics Workspace and integrated with Planning Analytics.
  • Installed, configured Planning Analytics with Planning Analytics Workspace on Windows 2016, other Windows OS, AIX, Linux. 


You may also like reading blogs “ What is IBM Planning Analytics Local ” , “IBM TM1 10.2 vs IBM Planning Analytics


Who are Octane Software Solutions?

Octane Software Solutions is an official IBM Business Partner. We specialise in performance management solutions including on-shore and off-shore TM1 delivery. We provide our clients advice on best practices in Business Intelligence and scaling up applications to optimise your return on investment. By working with Octane you do not need to compromise on delivery, support, expertise, and training for end-to-end solutions that are cost effective as well as competitive.

For more details, please visit: www.octanesolutions.com.au

Srinivas is a Senior Technical Consultant at Octane Software Solutions. Learn more about Srinivas via LinkedIn. 

Got a question? Shoot!

Lorem ipsum dolor sit amet, consectetur adipiscing elit, sed do eiusmod tempor incididunt ut labore et dolore magna aliqua.

Get more articles like this delivered to your inbox