Amin Mohammad, the IBM Planning Analytics Practice Lead at Octane Solutions, is taking you through his top 12 capabilities of Planning Analytics, in 2023. These are his personal favorites and there could be more than what he is covering. He has decided to divide his list into PAFe and PAW, as they have their own unique capabilities, and to highlight them separately. Planning Analytics for Excel ...
- Top 12 Planning Analytics features that you should be using in 2023
- What's new in Cognos Analytics 12.1.x
- Octane’s AI Contract Analyser & Ask Procurement Portal: Transforming Contract Review for Modern Enterprises
- Transform Enterprise Performance with IBM Analytics and AI Solutions
- Integrating transactions logs to web services for PA on AWS using REST API
- Tips on how to manage your Planning Analytics (TM1) effectively
Amin Mohammad, the IBM Planning Analytics Practice Lead at Octane Solutions, is taking you through his top 12 capabilities of Planning Analytics, in 2023. These are his personal favorites and there could be more than what he is covering.
He has decided to divide his list into PAFe and PAW, as they have their own unique capabilities, and to highlight them separately.
Planning Analytics for Excel (PAfE)
1. Support for alternate hierarchies in TM1 Web and PAfE
Starting with TM1 Set function, which has finally opened the option to use alternate hierarchies in TM1 web. it contains nine arguments as opposed to the four in SubNM adding to its flexibility. It also supports MDX expressions as one of the arguments. This function can be used as a good replacement for SubNM.
2. Updated look for cube viewer and set editor
The Planning Analytics Workspace and Cognos Analytics have taken the extra step to provide a consistent user experience. This includes the incorporation of the Carbon Design Principles, which have been implemented in the Set Editor and cube viewer n PaFe. This allows users to enjoy an enhanced look and feel of certain components within the software, as well as improved capabilities. This is an excellent addition that makes the most out of the user experience.
3. Creating User Define Calculations (UDC)
Hands down, the User Defined Calculations is by far the most impressive capability added recently. This capability allows you to create custom calculations using the Define calc function in PAFe, which also works in TM1 Web. With this, you can easily perform various calculations such as consolidating data based on a few selected elements, performing arithmetic calculations on your data, etc. Before this capability, we had to create custom consolidation elements in the dimension itself to achieve these results in PAfE, leading to multiple consolidated elements within the dimension, making it very convoluted. Tthe only downside is that it can be a bit technical for some users who use this, making it a barrier to mass adoption. Additionally, the sCalcMun argument within this function is case-sensitive, so bear that in mind. Hoping this issue is fixed in future releases.
4. Version Control utility
The Version Control utility helps to validate whether the version of Pathway you are using is compatible with the data source version of Planning Analytics Logo. If the two versions are not compatible, you cannot use Pathway until you update the software. The Version Control uses three capability or compatibility types to highlight the status of the compatibility:
- normal
- warning
- blocked
Administrators can also configure the Version Control to download a specific version of Pathway when the update button is clicked, helping to ensure the right version of Pathway is used across your organization.
Planning Analytics Workspace (PAW)
5. Single Cell widget
Planning Analytics Workspace has recently added the Single Cell widget as a visualization, making it easier to update dimension filters. Before this, the Single Cell widget could be added by right-clicking a particular data point, but it had its limitations.
One limitation that has been addressed is the inability to update dimension filters in the canvas once the widget has been added. In order to update it, one has to redo all steps, but the single widget visualization has changed this. Now, users can change the filters and the widget will update the data accordingly. This has been a great improvement as far as enhancing user experience goes.
Additionally, the widget can be transformed into any other visualization and vice versa. When adding the widget, the data point that was selected at that point is reflected in it. If nothing is selected, the top left of the first data point in the view is used to create the widget.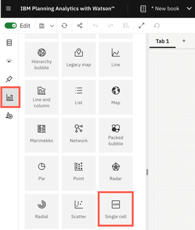
6. Sending email notifications to Contributors
You can now easily send email notifications to contributors with the click of a button from the Contribution Panel of the Overview Report. When you click the button, it sends out an email to the members of the group that has been assigned the task. The email option is only activated when the status is either pending approval or pending submission. Clicking the icon will send the email to all the members assigned to the group for the task.
7. Add task dependencies
Now, you can add task dependencies to plans, which allows you to control the order in which tasks can be completed. For example, if there are two tasks and Task Two is dependent on Task One, Task Two cannot be opened until Task One is completed. This feature forces users to do the right thing by opening the relevant task and prevents other tasks from being opened until the prerequisite task is completed. This way, users are forced to follow the workflow and proceed in the right order.
8. Approval and Rejections in Plans with email notifications
The email notifications meintioned here are not manually triggered like the ones in the 6th top picks. These emails are fully automated and event-based. The events that trigger these emails could be opening a plan step, submitting a step, or approving or rejecting a step. The emails that are sent out will have a link taking the user directly to the plan step in question, making the planning process easier for the users to follow.
"The worklow capabilities of the Planning Analytics Workspace have seen immense improvements over time. It initially served as a framework to establish workflows, however, now it has become a fully matured workflow component with many added capabilities. This allows for a more robust and comprehensive environment for users, making it easier to complete tasks."
9. URL to access the PAW folder
PAW (Planning Analytics Workspace) now offers the capability to share links to a folder within the workspace. This applies to all folders, including the Personal, Favorites, and Recent tabs. This is great because it makes it easier for users to share information, and also makes the navigation process simpler. All around, this is a good addition and definitely makes life easier for the users.
10. Email books or views
The administrator can now configure the system to send emails containing books or views from Planning Analytics Workspace. Previously, the only way to share books or views was to export them into certain formats. However, by enabling the email functionality, users are now able to send books or views through email. Once configured, an 'email' tab will become available when viewing a book, allowing users to quickly and easily share their content. This option was not previously available.
11. Upload files to PA database
Workspace now allows you to upload files to the Planning Analytics database. This can be done manually using the File Manager, which is found in the Workbench, or through a TI process. IBM has come up with a new property within the action button that enables you to upload the file when running the TI process. Once the file is uploaded, it can be used in the TI process to load data into TM1. This way, users do not have to save the file in a shared location and can simply upload it from their local desktop and load the data. This is a handy new functionality that IBM has added. Bear in mind that the file cannot be run until it has been successfully uploaded, so if the file is large, it may take time.
12. Custom themes
Finally, improvements in custom themes. Having the ability to create your own custom themes is incredibly helpful in order to align the coloring of your reports to match your corporate design. This removes the limitation of only being able to use pre-built colors and themes, and instead allows you to customize it to your specific requirements. This gives you the direct functionality needed to make it feel like your own website when any user opens it.
That's all I have for now. I hope you found these capabilities insightful and worth exploring further.
If you want to see the full details of this blogpost. Click here
Download a copy of PDF file
Download here if you want to see the full details of this blogpost
Dashboards:
Distinction between Display and Use value in dashboards:
You can now define Display and Use values in data modules.
The Display values are the values that you can see in a dashboard UI; the Use values are primarily for filtering logic.
Previously, defining the Display and Use values was possible only in FM packages. This feature brings the same capability to data modules and enhances consistency across dashboards and reporting. You can interact with readable values while filters apply precise underlying identifiers. For example, you can select a Customer ID value in the dashboard UI and apply a filter that is based on the Customer Name value.
Manage filter size and filter area visibility:
You can now resize filter columns and hide filter areas to improve the arrangement and visibility of these elements in dashboards.
For more information on resizing filter columns in the All tabs and This tab filter areas, see Resizing filters.
For more information on hiding and reshowing the filter areas, see Hiding and showing filter areas.
Option for users to export visualisation data to a CSV file:
You can now allow your users to export visualisation data to a .csv file.

To enable this feature, open a dashboard or a report that contains a visualisation, go to Properties > Advanced, and turn on the Allow users access to data option.
When this option is active, users can open the data tray and download the .csv file from the Visualisation data tab. Enabling this feature also adds an Export to CSV button and Export to CSV icon to the toolbar. The button is visible to the users and to the editors. If you turn off this feature, the button disappears.
Responsive dashboard layout:
The 12.1.1 release introduces a responsive layout feature for dashboards.
This feature enhances the authoring experience and usability across different devices by optimising the dashboard layout for various screen sizes, including mobile devices. You can also use it for grouping the content and organising visualisations.
To use a responsive layout, go to the Responsive tab when you create a new dashboard and select one of the available templates, as seen in the following image:

The responsive dashboard layout feature comes with the following key capabilities:
- Layout selection:
You can now choose between responsive and non-responsive layouts when you create a new dashboard.
- Adaptive widgets:
If you change the position of a panel or resize the dashboard window, the widget automatically adapts its placement and alignment.
- Intuitive resizing and swapping:
Smart alignment algorithms facilitate smooth layout transitions, while an intuitive interface makes the authoring experience smoother and more efficient.
- Drop zones for precise widget placement:
Each layout cell supports five drop zones: top, right, bottom, left, and center. You can use these zones for more control over widget placement.
- Cell deletion:
Dashboards now differentiate between empty and populated cells for accurate deletion.
- Data population:
The feature mirrors data population from the non-responsive layouts, supports drag-and-drop function, and slot item selection. If you use the copy and paste or click-add-to functions, the feature uses a smart placement logic to make sure that it adds the content to empty cells. It can also split the data between existing cells.
- Window resizing:
You can now dynamically resize a dashboard and its layout automatically adapts to the new screen size. It includes transition to a single-column or two-column layouts on smaller screens for enhanced readability.
- Printing to PDF files:
You can print the dashboard to a .pdf file in View mode and in the New Page mode.
- Nested dashboard widgets:
You can use the nested dashboard widgets as standard widgets or as containers for grouping and organising the content.
To successfully implement the responsive layout, you must make sure that the dashboard uses manifest version 12.1.1 or later and confirm widget boundaries by employing the layout grid. However, if the widgets do not render correctly, check the layout specification and verify the feature support.
Secure dashboard consumption with execute and traverse permissions:
Users can now consume dashboards with execute and traverse permissions granted to presented data, no read permission is required.
In the previous releases of IBM® Cognos® Analytics, the read permission was required for dashboards consumption. This might cause a sensitive data compromise because dashboard consumers could edit and copy such data.
Important: To strengthen the protection of data that you want to be consumed by other users, modify these users' permissions from Read to Execute and Traverse before you migrate to Cognos Analytics 12.1.1.
However, the execute and traverse permissions put some restrictions on actions that can be taken by a dashboard consumer. Therefore, the consumer cannot perform the following actions:
-
Drill up and down
-
Export
-
Narrative insights
-
Navigate
-
Open dashboards
-
Paste copied widgets into another dashboard.
-
Pin
-
Save
-
Save as a story
-
See the full data set in the data tray.
-
Share
-
Switch to Edit mode.
Personalised dashboard views:
The 12.1.1 release comes with a new feature for simplified customisation of complex dashboard designs.
A dashboard view is a feature that references a base dashboard, which contains your individual filters and settings. It supports the following customisation features:
-
Filters
-
Brushing, excluding local filters on individual visualisations
-
Bookmarks, including the ability to set the currently selected tab
You can create dashboard views only from an open dashboard and from within the dashboard studio, and only against saved dashboards. If the open dashboard is saved, a Save as dashboard view option appears in the save menu:

This operation works as a standard Save as operation. When the operation is complete, the original dashboard is still displayed. To access the new dashboard view, you must open it manually from the content navigation panel.
The dashboard views have a different icon from regular dashboards. It includes an eye overlay, which is similar to a report views icon:

You can customise a dashboard view by changing the brushing, filter, or bookmarks, and then saving the view. However, the dashboard view is essentially in a Consume mode, and you can't switch to the authoring mode. It also means that you can't access the metadata tree of the dashboard view or add extra filter controls to the filter dock. If you want your users to apply filters in a metadata column, you must first add that column to the base dashboard, even if you don't initially select any filter values.
Any updates that you make to a base dashboard automatically appear in the dashboard view, except for the custom options that you define in the dashboard view itself. You can see the changes the next time that you open the dashboard view. For example, if you delete a visualisation from the main dashboard, it no longer appears in the dashboard view.
The Save as dashboard view operation also creates a non-editable bookmark in the dashboard view. This bookmark includes the state of filters and brushing that you applied in the dashboard at the time when the dashboard view was created or last saved. When you open the dashboard view and don't select any other bookmark, this bookmark is automatically selected.

The dashboard views not only consume bookmarks from the base dashboards, but they also can have their own bookmarks. You can create them in the same way as in standard dashboards. The Cognos® Analytics UI differentiates between Shared bookmarks, so all bookmarks from the base dashboards, and My bookmarks, which are bookmarks from the dashboard view.

If you delete the base dashboard, you can't open the dashboard view, and its entry is disabled in the content navigation. All attempts to access that dashboard view by entering its URL address directly into a browser result in an error message. Also, the Source dashboard property appears as Unavailable, for example:

Reporting:
Enhanced clarity of reporting templates view:
Release 12.1.1 enhances the user experience of navigating through report templates.
When you open the Create a report page, it shows only templates that match the Report filter value. This change hides all Active Reports templates by default and makes only the Report templates visible.

You can use the Filter icon to customise your view. To maintain a personalised experience, Cognos® Analytics saves your selection in local storage or by using the cached value.
This enhancement also comes with upgraded filter labels, which reflect the current filter value, for example: Showing All Templates, Showing Report Templates, or Showing Active Report Templates.
Manage queries in the report cache:
You can manage which data queries are included in the report cache to control report performance.
For more information on the report cache, see Caching Prompt Data.
For example, queries to data sources that cannot be accessed by all users, user-dependent, might degrade the report performance.
You can exclude report performance-degrading queries from cached prompt data by setting the value of the Report cache property to No in the query property pane:
-
In the navigation menu, click Report, then Queries in the drop-down menu.
-
In the Queries pane, select a query.
-
In the Properties pane, in the QUERY HINTS section, click the Report cache property.
-
Select one of the following values:
-
Default - the query is included in the report cache
-
Yes - equivalent to the Default value.
-
No - the query is excluded from the report cache.
For multi-level queries, this value is transferred from the lowest-level to the highest-level query.
PostgreSQL audit deployment and model:
The 12.1.1 release comes with a new capability for enhanced auditing and reporting in environments that use PostgreSQL as the auditing database.
You can use a dedicated Framework Manager model and a deployment package to run reports against a PostgreSQL audit database. These resources provide a structure for analysing the audit data and creating insightful reports.
You can access the new samples in the following locations within your installation directory:
<installation>/samples/Audit_samples/Audit_Postgres
<installation>/samples/Audit_samples/IBM_Cognos_Audit_Postgres.zip
To use the PostgreSQL audit samples, make sure to create a data source connection named Audit_PG.
Master detail relationships with 11.1 visualisations:
You can use 11.1 visualisations in master detail relationships to present details for each master query item in a consolidated, insightful way.
For more information on master detail relationships, see Master detail relationships.
For the 11.1 visualisations as the detail objects, you can now choose if the same automatic value range is used in all visualisation instances in a master detail relationship. You apply your choice to the Same range for all instances of the chart option. To turn this option off or on, perform the following steps:
-
Select a visualisation for which a master details relationship is created.
-
In the Data Set pane of this visualisation, click the data item that defines values on the value axis.
-
In the Properties pane, under GENERAL, click the More icon 3 dots in the filter area right of the Value range property.
-
In the Value range window:
-
Select Computed.
-
Turn off or on the Same range for all instances of the chart option, depending on whether you want to use in the instances the global extrema, the biggest value range of all instances, or the local extrema, the value range of each visualisation.
Procurement teams today are under pressure to move faster, reduce risk, and operate with greater transparency. Yet contract review — one of the most critical procurement responsibilities — remains slow, manual, and highly inconsistent across most organisations.
A major enterprise client came to Octane facing exactly this challenge. Their procurement function was overwhelmed: contracts were buried in inboxes, reviews took hours, and comparing updated versions created delays and negotiation blind spots.
Octane delivered a powerful, AI-enabled solution using IBM WatsonX Orchestrate — combining a Contract Analyser with an intelligent Ask Procurement interface. Together, these capabilities have redefined how the client manages contract intake, review, insights, and procurement intelligence at scale.

The Business Challenge
The client’s procurement team was experiencing significant bottlenecks:
-
Contract overload and inbox chaos
Supplier agreements arrived via email and were often lost or delayed, slowing downstream purchasing decisions.
-
Time-consuming manual analysis
Procurement staff could spend 1–3 hours per contract summarising content, identifying risks, and preparing commentary for stakeholders.
-
Difficulty comparing contract versions
Updated supplier contracts required line-by-line manual comparison, often leading to missed red flags and weaker negotiation leverage.
-
Limited visibility into procurement insights
Leaders had no quick way to query procurement data, trends, supplier risks, or anomalies.
These issues created avoidable risk, slowed procurement cycles, and stretched team capacity.
The Octane Solution: AI-Enabled Contract Analyser + Ask Procurement
Octane deployed a streamlined, automated solution powered by IBM WatsonX Orchestrate that addresses both contract processing and procurement intelligence.
✔ AI Contract Analyser
The analyser automatically:
-
Captures new supplier contracts the moment they appear in email
-
Extracts and understands contract text
-
Summarises key clauses and obligations
-
Identifies risks, red flags, and missing components
-
Highlights differences between contract versions
-
Generates a negotiation playbook
-
Delivers insights to stakeholders instantly
This means procurement teams no longer read contracts line-by-line — the AI does the heavy lifting.
✔ Ask Procurement: AI interface for procurement intelligence
As part of the deliverable, Octane introduced Ask Procurement, a conversational AI interface that allows users to:
-
Query procurement data
-
Identify spend trends
-
Detect anomalies in contracts or vendors
-
Access historical contract insights
-
Surface negotiation patterns
-
Review supplier performance indicators
Whether it’s “Show me all suppliers with auto-renewal clauses” or “Summarise risk trends for our top five vendors,” Ask Procurement provides instant answers.
Together, these tools create a true digital procurement co-pilot.
The Impact for the Client
The benefits have been significant and immediate:
-
Review time reduced to under a minute
What previously took hours now happens automatically — contracts are analysed, summarised, and compared in seconds.
-
Reduced legal and commercial risk
The AI produces a structured risk register, helping teams spot issues earlier and make more informed decisions.
- Stronger negotiation positions
The system highlights:
-
What changed between versions
-
Why it matters
-
Recommended negotiation arguments
This gives the procurement team a consistent, data-driven advantage.
-
Faster procurement cycle times
Automated intake and instant insights have removed bottlenecks, improving:
- Supplier onboarding
- Purchase approvals
- Contract turnaround times
-
No more lost contracts
The AI automatically captures, stores, and processes every attachment.
-
Improved organisational intelligence
With Ask Procurement, leaders now have:
-
Instant visibility
-
Searchable procurement knowledge
-
On-demand insights
-
Clear trend analysis
This shifts procurement from reactive to proactive.
Why This Matters
This project demonstrates what applied enterprise AI looks like in the real world — practical, operational, and immediately beneficial.
It shows how organisations can:
-
Modernise procurement without replacing systems
-
Automate high-effort tasks with intelligent workflows
-
Strengthen compliance and governance
-
Provide teams with insights previously locked away in documents
-
Use AI as an everyday digital procurement analyst
It also reinforces that AI is not only for futuristic use cases — it is delivering meaningful value today.
What’s Next: Full Lifecycle Automation with E-Signature
The next extension is already underway:
AI-driven e-signature workflows, enabling:
-
Automated signing
-
Routing and approval
-
Audit trails
-
Archiving and version control
This will close the loop across the entire procurement lifecycle:
Intake → Review → Insights → Decision → Signature → Storage
Conclusion
Octane’s AI Contract Analyser and Ask Procurement portal offer a new way forward for procurement teams looking to accelerate productivity, reduce risk, and enhance decision-making.
By combining IBM WatsonX Orchestrate, structured AI reasoning, and deep procurement expertise, Octane has delivered a real-world, production-ready solution that transforms how contracts — and procurement intelligence — are managed at scale.
If you'd like to explore how this could work inside your organisation, the Octane team is ready to demonstrate what’s possible.
In today’s volatile business landscape, agility is no longer a competitive advantage—it’s a necessity. True agility means moving beyond fast response to actively anticipating market shifts and seamlessly aligning people, processes, and technology to act decisively.
.png?width=595&height=341&name=From%20Insight%20to%20Impact%20(1).png)
Enterprises possess vast troves of data, yet the ultimate differentiator is the ability to transform that data into actionable insights and automated, intelligent decisions. At Octane Analytics, we are driving this transformation across industries by evolving disconnected reporting tools into a unified, intelligent ecosystem powered by IBM's premier analytics and AI platforms.
The Unified Framework for Intelligent Decisions
IBM’s comprehensive suite of solutions—including Planning Analytics, Cognos Analytics, SPSS, Decision Optimisation, Controller, and Watsonx Orchestrate—delivers a connected framework that manages business performance from strategic vision through to operational execution. This integration establishes a data-to-decision continuum where insights fluidly integrate into planning, execution, and automation cycles.
- IBM Planning Analytics moves organisations beyond static budgeting to dynamic, driver-based forecasting and scenario modelling.
- IBM Cognos Analytics empowers business users with AI-driven dashboards and visualisation tools for deep insight exploration.
- IBM SPSS integrates statistical precision and data science into business planning, ensuring predictions are rooted in reliable data, not intuition.
- IBM Decision Optimisation models complex business scenarios to identify the most efficient and optimal outcomes.
- IBM Controller simplifies and automates financial consolidation, closing, and regulatory reporting.
- IBM Watsonx Orchestrate enables non-developers to automate repetitive workflows, directly connecting insights to business action without writing code.
The Pivot to Predictive and Prescriptive Analytics
Many organisations remain reactive, focused on analysing "what happened." The step-change in performance occurs when analytics shift to answering the crucial questions: “what will happen?” (Predictive) and “what should we do about it?” (Prescriptive).
The integrated IBM ecosystem facilitates this critical shift:
-
Prediction Informs Strategy: Predictive models built in SPSS directly inform forecasts within Planning Analytics, making financial and operational plans immediately responsive to market shifts.
-
Prescription Optimises Action: Decision Optimisation identifies the best sequence of actions to achieve a business goal, operating within specified constraints.
-
Automation Operationalises Insight: Watsonx Orchestrate then automates the prescribed follow-up actions—whether triggering workflows in HR, Finance, or Operations—significantly boosting responsiveness and reducing manual workload
This synergy elevates the organisation from merely data-driven to decision-driven, where insights are not just observed but fully operationalised.
AI and Automation: Transforming Finance and Operations
Automation is no longer confined to the IT department. Today, modern CFOs, HR executives, and department leaders are leveraging agentic AI to offload repetitive, high-volume tasks and achieve new levels of efficiency.
Consider the impact across key functions:
- Financial Performance Management: Imagine a Finance Manager who automatically receives consolidated reports prepared by the IBM Controller, reviewed with AI-assisted insights from Cognos Analytics, and validated against dynamic budget forecasts from Planning Analytics.
- Intelligent HR Operations: A People Leader uses Watsonx Orchestrate to streamline repetitive HR tasks—from scheduling interviews and summarising resumes to ensuring records are instantly updated across all ERP systems.
At Octane Analytics, we specialise in designing and deploying these agentic AI ecosystems, ensuring automation amplifies human capability and drives measurable outcomes.
Why Choose Octane Analytics?
As an IBM Gold Partner, Octane Analytics offers deep, specialised expertise in integrating and optimising IBM’s entire performance management stack.
Our approach is centred not just on product deployment, but on measurable business outcomes: enhanced agility in planning, increased accuracy in forecasting, greater efficiency in reporting, and empowerment through automation.
Whether your immediate need is strategic financial consolidation or a full-scale enterprise performance management overhaul, our team provides the expertise to define the roadmap, deliver the integrated solution, and ensure a demonstrable Return on Investment (ROI).
The Future: A Connected, AI-Powered Enterprise
The future of enterprise performance hinges on connected intelligence—an environment where AI and analytics continuously learn, adapt, and act across all business functions.
Organisations that master this integrated, AI-first approach will not only achieve operational efficiency but also build unparalleled resilience and foresight in a rapidly changing global market. At Octane Analytics, we are committed to helping enterprises realise this future, one intelligent decision at a time.
Let’s Build the Intelligent Enterprise Together
If you are exploring how integrated AI, advanced analytics, and automation can significantly elevate your business performance, we invite you to connect with us. Our team can provide tailored, real-world use case demonstrations—from predictive planning to automated workflow execution—all powered by IBM’s market-leading technology.
📩 Reach out to Octane Analytics today to schedule a discovery session.
In this blog post, we will showcase the process of exposing the transaction logging on Planning Analytics (PA) V12 on AWS to the users. Currently, in Planning Analytics there is no user interface (UI) option to access transaction logs directly from Planning Analytics Workspace. However, there is a workaround to expose transactions to a host server and access the logs. By following these steps, you can successfully access transaction logged in Planning Analytics V12 on AWS using REST API.

Step 1: Creating an API Key in Planning Analytics Workspace
The first step in this process is to create an API key in Planning Analytics Workspace. An API key is a unique identifier that provides access to the API and allows you to authenticate your requests.
- Navigate to the API Key Management Section: In Planning Analytics Workspace, go to the administration section where API keys are managed.
- Generate a New API Key: Click on the option to create a new API key. Provide a name and set the necessary permissions for the key.
- Save the API Key: Once the key is generated, save it securely. You will need this key for authenticating your requests in the following steps.
Step 2: Authenticating to Planning Analytics As a Service Using the API Key
Once you have the API key, the next step is to authenticate to Planning Analytics as a Service using this key. Authentication verifies your identity and allows you to interact with the Planning Analytics API.
- Prepare Your Authentication Request: Use a tool like Postman or any HTTP client to create an authentication request.
- Set the Authorization Header: Include the API key in the Authorization header of your request. The header format should be Authorization: Bearer <API Key>.
- Send the Authentication Request: Send a request to the Planning Analytics authentication endpoint to obtain an access token.
Detailed instructions for Step 1 and Step 2 can be found in the following IBM technote:
How to Connect to Planning Analytics as a Service Database using REST API with PA API Key
Step 3: Setting Up an HTTP or TCP Server to Collect Transaction Logs
In this step, you will set up a web service that can receive and inspect HTTP or TCP requests to capture transaction logs. This is crucial if you cannot directly access the AWS server or the IBM Planning Analytics logs.
- Choose a Web Service Framework: Select a framework like Flask or Django for Python, or any other suitable framework, to create your web service.
- Configure the Server: Set up the server to listen for incoming HTTP or TCP requests. Ensure it can parse and store the transaction logs.
- Test the Server Locally: Before deploying, test the server locally to ensure it is correctly configured and can handle incoming requests.
For demonstration purposes, we will use a free web service provided by Webhook.site. This service allows you to create a unique URL for receiving and inspecting HTTP requests. It is particularly useful for testing webhooks, APIs, and other HTTP request-based services.
Step 4: Subscribing to the Transaction Logs
The final step involves subscribing to the transaction logs by sending a POST request to Planning Analytics Workspace. This will direct the transaction logs to the web service you set up.
Practical Use Case for Testing IBM Planning Analytics Subscription
Below are the detailed instructions related to Step 4:
- Copy the URL Generated from Webhook.site:
- Visit siteand copy the generated URL (e.g., https://webhook.site/<your-unique-id>). The <your-unique-id> refers to the unique ID found in the "Get" section of the Request Details on the main page.

- Subscribe Using Webhook.site URL:
- Open Postman or any HTTP client.
- Create a new POST request to the subscription endpoint of Planning Analytics.
- In Postman, update your subscription to use the Webhook.site URL using the below post request:

- In the body of the request, paste the URL generated from Webhook.site:
{
"URL": "https://webhook.site/your-unique-id"
}
<tm1db> is a variable that contains the name of your TM1 database.
Note: Only the transaction log entries created at or after the point of subscription will be sent to the subscriber. To stop the transaction logs, update the POST query by replacing /Subscribe with /Unsubscribe.
By following these steps, you can successfully enable and access transaction logs in Planning Analytics V12 on AWS using REST API.
Effective management of Planning Analytics (TM1), particularly with tools like IBM’s TM1, can significantly enhance your organization’s financial planning and performance management.

Here are some essential tips to help you optimize your Planning Analytics (TM1) processes:
1. Understand Your Business Needs
Before diving into the technicalities, ensure you have a clear understanding of your business requirements. Identify key performance indicators (KPIs) and metrics that are critical to your organization. This understanding will guide the configuration and customization of your Planning Analytics model.
2. Leverage the Power of TM1 Cubes
TM1 cubes are powerful data structures that enable complex multi-dimensional analysis. Properly designing your cubes is crucial for efficient data retrieval and reporting. Ensure your cubes are optimized for performance by avoiding unnecessary dimensions and carefully planning your cube structure to support your analysis needs.
3. Automate Data Integration
Automating data integration processes can save time and reduce errors. Use ETL (Extract, Transform, Load) tools to automate the extraction of data from various sources, its transformation into the required format, and its loading into TM1. This ensures that your data is always up-to-date and accurate.
4. Implement Robust Security Measures
Data security is paramount, especially when dealing with financial and performance data. Implement robust security measures within your Planning Analytics environment. Use TM1’s security features to control access to data and ensure that only authorized users can view or modify sensitive information.
5. Regularly Review and Optimize Models
Regularly reviewing and optimizing your Planning Analytics models is essential to maintain performance and relevance. Analyze the performance of your TM1 models and identify any bottlenecks or inefficiencies. Periodically update your models to reflect changes in business processes and requirements.
6. Utilize Advanced Analytics and AI
Incorporate advanced analytics and AI capabilities to gain deeper insights from your data. Use predictive analytics to forecast future trends and identify potential risks and opportunities. TM1’s integration with other IBM tools, such as Watson, can enhance your analytics capabilities.
7. Provide Comprehensive Training
Ensure that your team is well-trained in using Planning Analytics and TM1. Comprehensive training will enable users to effectively navigate the system, create accurate reports, and perform sophisticated analyses. Consider regular training sessions to keep the team updated on new features and best practices.
8. Foster Collaboration
Encourage collaboration among different departments within your organization. Planning Analytics can serve as a central platform where various teams can share insights, discuss strategies, and make data-driven decisions. This collaborative approach can lead to more cohesive and effective planning.
9. Monitor and Maintain System Health
Regularly monitor the health of your Planning Analytics environment. Keep an eye on system performance, data accuracy, and user activity. Proactive maintenance can prevent issues before they escalate, ensuring a smooth and uninterrupted operation.
10. Seek Expert Support
Sometimes, managing Planning Analytics and TM1 can be complex and may require expert assistance. Engaging with specialized support services can provide you with the expertise needed to address specific challenges and optimize your system’s performance.
By following these tips, you can effectively manage your Planning Analytics environment and leverage the full potential of TM1 to drive better business outcomes. Remember, continuous improvement and adaptation are key to staying ahead in the ever-evolving landscape of financial planning and analytics.
For specialized TM1 support and expert guidance, consider consulting with professional service providers like Octane Software Solutions. Their expertise can help you navigate the complexities of Planning Analytics, ensuring your system is optimized for peak performance. Book me a meeting
In a recent announcement, IBM unveiled changes to the Continuing Support program for Cognos TM1, impacting users of version 10.2.x. Effective April 30, 2024, Continuing Support for this version will cease to be provided. Let's delve into the details.
.png?width=573&height=328&name=blog%20(1).png)
What is Continuing Support?
Continuing Support is a lifeline for users of older software versions, offering non-defect support for known issues even after the End of Support (EOS) date. It's akin to an extended warranty, ensuring users can navigate any hiccups they encounter post-EOS. However, for Cognos TM1 version 10.2.x, this safety net will be lifted come April 30, 2024.
What Does This Mean for Users?
Existing customers can continue using their current version of Cognos TM1, but they're encouraged to consider migrating to a newer iteration, specifically Planning Analytics, to maintain support coverage. While users won't be coerced into upgrading, it's essential to recognize the benefits of embracing newer versions, including enhanced performance, streamlined administration, bolstered security, and diverse deployment options like containerization.
How Can Octane Assist in the Transition?
Octane offers a myriad of services to facilitate the transition to Planning Analytics. From assessments and strategic planning to seamless execution, Octane support spans the entire spectrum of the upgrade process. Additionally, for those seeking long-term guidance, Octane Expertise provides invaluable Support Packages on both the Development and support facets of your TM1 application.
FAQs:
-
Will I be forced to upgrade?
No, upgrading is not mandatory. Changes are limited to the Continuing Support program, and your entitlements to Cognos TM1 remain unaffected.
-
How much does it cost to upgrade?
As long as you have active Software Subscription and Support (S&S), there's no additional license cost for migrating to newer versions of Cognos TM1. However, this may be a good time to consider moving to the cloud.
-
Why should I upgrade?
Newer versions of Planning Analytics offer many advantages, from improved performance to heightened security, ensuring you stay ahead in today's dynamic business environment. This brings about unnecessary risk to your application.
-
How can Octane help me upgrade?
Octane’s suite of services caters to every aspect of the upgrade journey, from planning to execution. Whether you need guidance on strategic decision-making or hands-on support during implementation, Octane is here to ensure a seamless transition. Plus we are currently offering a fixed-price option for you to move to the cloud. Find out more here
In conclusion, while bidding farewell to Cognos TM1 10.2.x may seem daunting, it's also an opportunity to embrace the future with Planning Analytics. Octane stands ready to support users throughout this transition, ensuring continuity, efficiency, and security in their analytics endeavours.
The blogs brief about the challenge faced post enabling the Audit log in one of our client's environment. Once the audit log was turned on to capture the metadata changes, the Data Directory backup scheduled process started to fail.
After some investigation, I found the cause was the temp file (i.e., tm1rawstore.<TimeStamp> ) generated by the audit log by default and placed in the data directory.
The Temp file is used by audit log to record the events before moving it to a permanent file (i.e., tm1auditstore<TimeStamp>). Sometimes, you may even notice dimension related files (i.e., DimensionName.dim.<Timestamp>), and these files are generated by audit log to capture the dimension related changes.
The RawStoreDirectory is a tm1.cfg parameter related to the audit log, which helped us resolve the issue. This parameter is used to define the folder path for temporary, unprocessed log files specific to the audit log, i.e., tm1rawstore.<TimeStamp>, DimensionName.dim.<Timestamp>. If this Config is not set, then by default, these files get placed in Data Directory.
RawStoreDirectory = <Folderpath>
Now, let's also see other config parameters related to the audit logs
AuditLogMaxFileSize:
The config parameter can be used to control the maximum size audit log file to be before the file gets saved and a new file is created. The unit needs to be appended at the end of the value defined ( KB, MB, GB), and Minimum is 1KB and Maximum is 2GB; if this is not specified in the TM1 Cfg then the default value would be 100 MB.
AuditLogMaxFileSize=100 MB
AuditLogMaxQueryMemory:
The config parameter can be used to control maximum memory the TM1 server can use for running audit log query and retrieving the set. The unit needs to be appended at the end of the value defined ( KB, MB, GB) and Minimum is 1KB and Maximum is 2GB; if this is not specified in the TM1 Cfg then the default value would be 100 MB.
AuditLogMaxQueryMemory=200 MB
AuditLogUpdateInterval:
The config parameter can be used to control the amount of time the TM1 server needs to wait before moving the contents from temporary files to a final audit log file. The value is taken in minutes; that is, say 100 is entered, then it is taken has 100 minutes.
AuditLogUpdateInterval=100
That's it folks, hope you had learnt something new from this blog.
IBM has been recommending its users to move to Planning Analytics for Excel (PAX) from TM1 Perspective and/or from TM1 Web. This blog is dedicated to clients who have either recently adopted PAX or contemplating too and sharing steps on how to trace/watch TI process status while running process using Planning Analytics for Excel.
Steps below should be followed to run processes and to check TI process status.
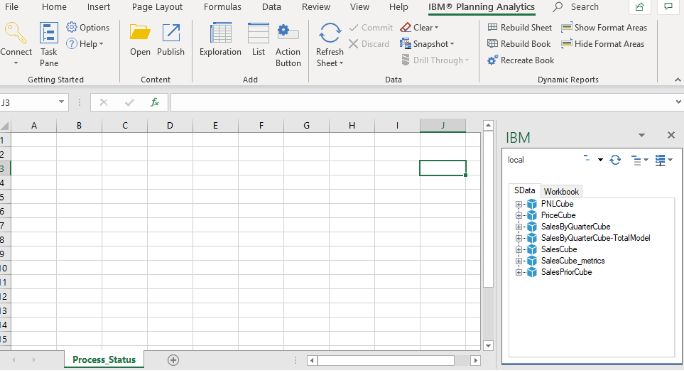
1. Once you connect to Planning Analytics for Excel, you will be able to see cubes on the right-hand side, else you may need to click on Task Pane.
2. Click on the middle icon as shown below and click on Show process. This will help show all process (to which respective user has access to) in Task Pane.
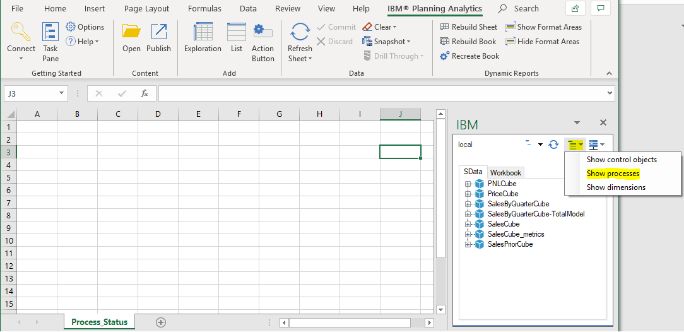
3. You will now be able to see Process.
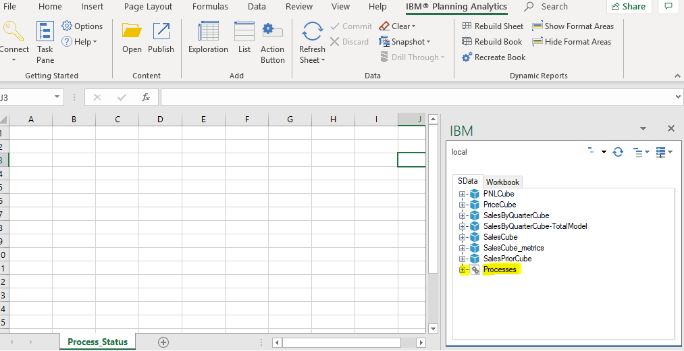
4. To check/ trace status of the process (when triggered via Planning analytics for excel) right-Click on Processes and click Active processes.
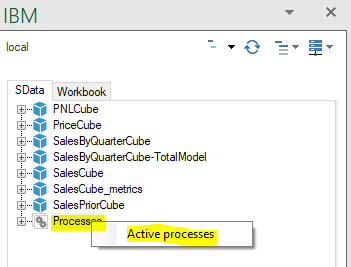
5. A new box will pop-up as shown below.

6. You can now run process from Task pane and check if you can track status in new box popped up in step 5.

7. You can now see the status of process in this box, below is a screen print that shows the for-process cub.price.load.data, process completed 4 tasks out of 5 tasks.

8. Below screen prints tells us if the status of TI process, they are Working , Completed and Process completed with Errors.
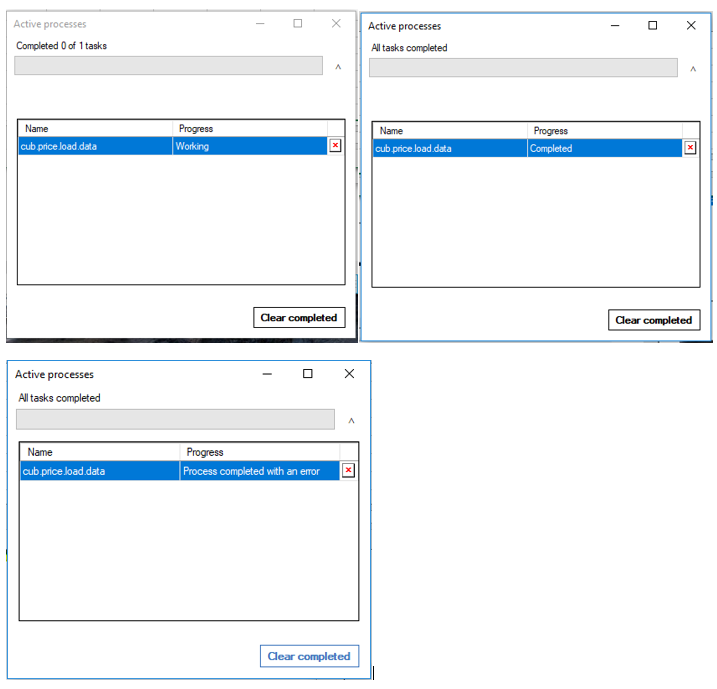
Once done, your should be able to to trace TI status in Planning Analytics for Excel. Happy Transitioning.
As I pen down my last Blog for 2019, wishing you and your dear ones a prosperous and healthy 2020.
Until next time....keep planning & executing.
This blog broaches all steps on how to install IBM Secure Gateway Client.
IBM Secure Gateway Client installation is one of the crucial steps towards setting up secure gateway connection between Planning Analytics Workspace (On-Cloud) and RDBMS (relational database) on-premise or on-cloud.
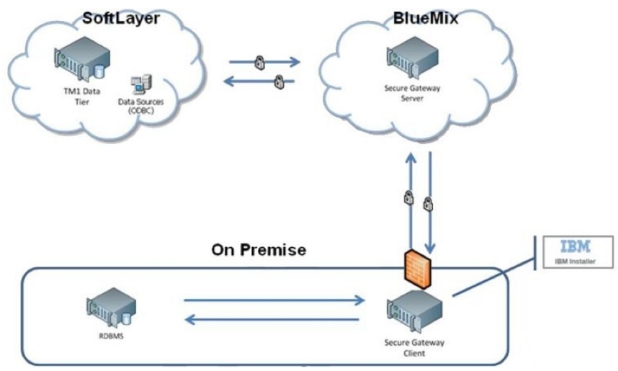
What is IBM Secure Gateway :
IBM Secure Gateway for IBM Cloud service provides a quick, easy, and secure solution establishing a link between Planning Analytics on cloud and a data source. Data source can reside on an “on-premise” network or on “cloud”. Data sources like RDBMS, for example IBM DB2, Oracle database, SQL server, Teradata etc.
Secure and Persistent Connection :
A Secure Gateway, useful in importing data into TM1 and drill through capability, must be created using TurboIntegrator to access RDBMS data sources on-premise.
By deploying the light-weight and natively installed Secure Gateway Client, a secure, persistent and seamless connection can be established between your on-premises data environment and cloud.
The Process:
This is two-step process,
- Create Data source connection in Planning Analytics Workspace.
- Download and Install IBM Secure Gateway
To download IBM Secure Gateway Client.
- Login to Workspace ( On-Cloud)
- Navigate to Administrator -> Secure Gate

Click on icon as shown below, this will prompt a pop up. One needs to select operating system and follow steps to install the client.
Once you click, a new pop-up with come up where you are required to select the operating system where you want to install this client.
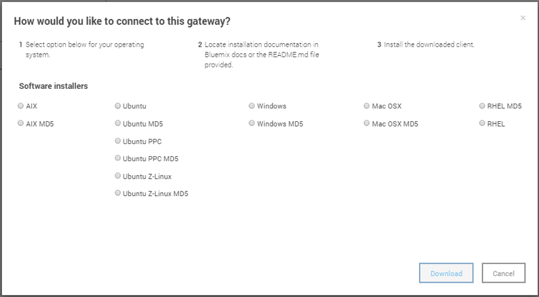
Choose the appropriate option and click download.
If the download is defaulted to download folders you will find the software in Download folder like below.

Installation IBM Secure Gateway Client:
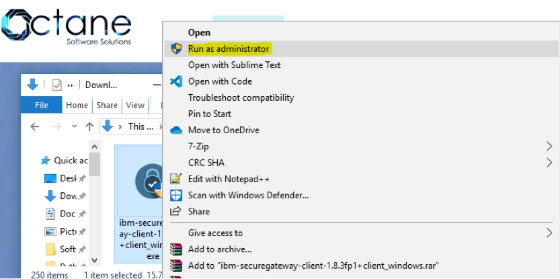
To Install this tool, right click and run as administrator.
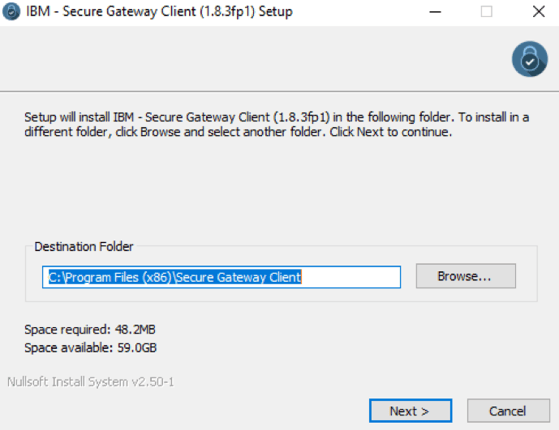
Keep the default settings for Destination folder and Language, unless you need to modify.
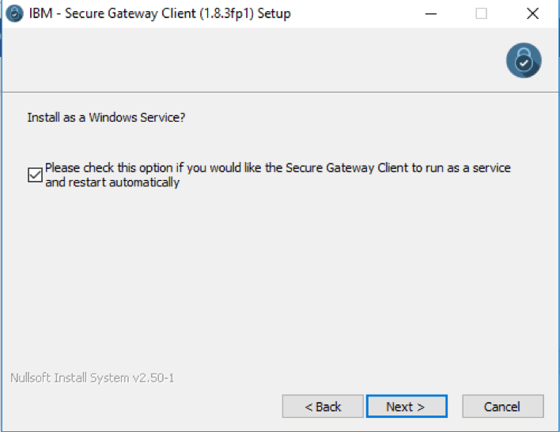
Check box below if you want this as Window Service.
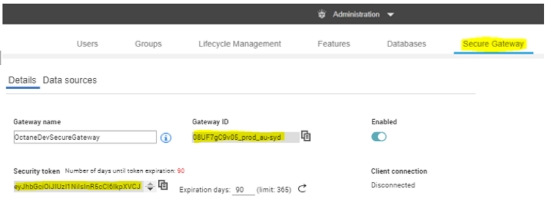
Now this is an important step, we are required to enter Gateway ids and security tokens to establish a secured connection. These needs to be copied over from Secure connection created earlier in Planning Analytics Workspace ( refer 1. Create Data source connection in workspace).
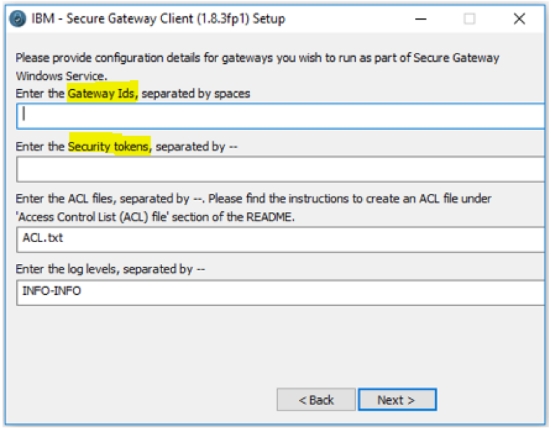
Figure below illustrates Workspace, shared details on Gateway ID and Security Token, these needs to be copied and pasted in Secure Gateway Client (refer above illustration).
If user chooses to launch the client with connection to multiple gateways, one needs to take care while providing the configuration values.
- The gateway ids need to be separated by spaces.
- The security tokens, acl files and log levels should to be delimited by --.
- If you don't want to provide any of these three values for a particular gateway, please use 'none'.
- If you want Client UI you may choose else select No.
Note: Please ensure that there are no residual white spaces.
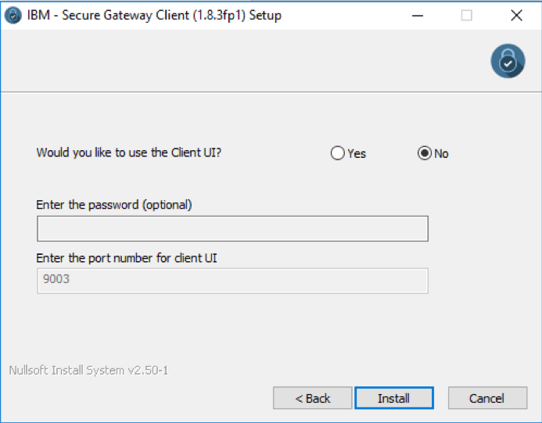
Now click Install, once this installation completes successfully, the IBM Secure Gateway Client is ready for use.
This Connection is now ready, Planning Analytics can now connect to data source residing on-premise or any other cloud infrastructure where IBM Secure Gateway client is installed.
You may also like reading “ Predictive & Prescriptive-Analytics ” , “ Business-intelligence vs Business-Analytics ” ,“ What is IBM Planning Analytics Local ” , “IBM TM1 10.2 vs IBM Planning Analytics”, “Little known TM1 Feature - Ad hoc Consolidations”, “IBM PA Workspace Installation & Benefits for Windows 2016”.
IBM Watson™ Studio is a platform for businesses to prepare and analyse data as well as build and train AI and machine learning models in a flexible hybrid cloud environment.
IBM Watson™ Studio enables your data scientists, application developers and subject matter experts work together easier and collaborate with the wider business, to deliver faster insights in a governed way.
Watch the below for another brief intro
Available in on the desktop which contains the most popular portions of Watson Studio Cloud to your Microsoft Windows or Apple Mac PC with IBM SPSS® Modeler, notebooks and IBM Data Refinery all within a single instal to bring you comprehensive and scalable data analysis and modelling abilities.
However, for the enterprise, there are also the versions of Watson Studio Local, which is a version of the software to be deployed on-premises inside the firewall, as well as Watson Studio Cloud is part of the IBM Cloud™, a public cloud platform. No matter which version your business may use you can start using Watson Studio Cloud and download a trial of the desktop version today!
Over the next 5 days, we'll ensure to send you use-cases and materials of worth for you to review at your earliest convenience. Be sure to check our social media pages for these.

IBM Planning Analytics (TM1) vs Anaplan
There has been a lot of chatter lately around IBM Planning Analytics (powered by TM1) vs Anaplan. Anaplan is a relatively new player in the market and has recently listed on NYSE. Reported Revenue in 2019 of USD 240.6M (interestingly also reported an operating loss of USD 128.3M). Compared to IBM which has a 2018 revenue of USD 79.5 Billion (there is no clear information on how much of this was from the Analytics area) with a net profit of 8.7 b). The size of global Enterprise Performance Management (EPM) is around 3.9 Billion and expected to grow to 6.0Billion by 2022. The size of spreadsheet based processes is a whopping 60 Billion (Source: IDC)
Anaplan has been borne out of the old Adaytum Planning application that was acquired by Cognos and Cognos was acquired by IBM in 2007. Anaplan also spent 176M on Sales and Marketing so most people in the industry would have heard of it or come across some form of its marketing. (Source: Anaplan.com)
I’ve decided to have a closer look at some of the crucial features and functionalities and assess how it really stacks up.
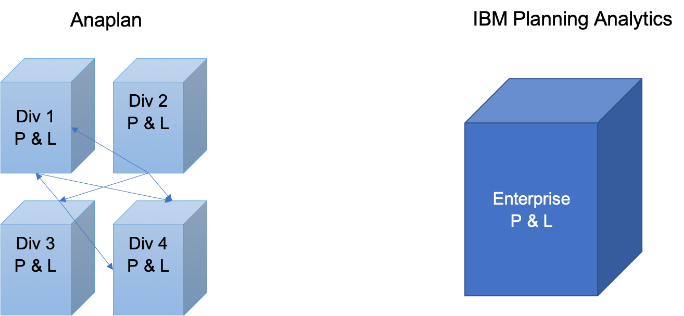
ScalabilityThere are some issues around scaling up the Anaplan cubes where large datasets are under consideration (8 billion cell limit? While this sounds big, most of our clients reach this scale fairly quickly with medium complexity). With IBM Planning Analytics (TM1) there is no need to break up a cube into smaller cubes to meet data limits. Also, there is no demand to combine dimensions to a single dimension. Cubes are generally developed with business requirements in mind and not system limitations. Thereby offering superior degrees of freedom to business analyst.
For example, if enterprise wide reporting was the requirement, then the cubes may be need to be broken via a logical dimension like region of divisions. This in turn would make consolidated reporting laborious, making data slicing and dicing difficult, almost impossible.
Excel Interface & Integration
Love it or hate it – Excel is the tool of choice for most analyst and finance professionals. I reckon it is unwise to offer a BI tool in today’s world without a proper excel integration. I find Planning Analytics (TM1) users love the ability to use excel interface to slice and dice, drill up and down hierarchies and drill to data source. The ability to create interactive excel reports with ability to have cell by cell control of data and formatting is a sure-shot deal clincher.
On the other hand, on exploration realized Anaplan offers very limited Excel support.


Analysis & Reporting
In today’s world users have come to expect drag and drop analysis. Ability to drill down, build and analyze alternate view of the hierarchy etc “real-time”. However, if each of this query requires data to be moved around cubes and/or requires building separate cubes then it’s counterproductive. This would also increase the maintenance and data storage overheads. You also lose sight of single source of truth as your start developing multiple cubes with same data just stored in different form. This is the case with Anaplan due to the software’s intrinsic limitations.
Anaplan also requires users to invest on separate reporting layer as it lacks native reporting, dashboards and data visualizations.
This in turn results in,
- Increase Cost
- Increase Risk
- Increase Complexity
- Limited planning due to data limitations
IBM Planning Analytics, on the contrary offers out of the box ability to view & analyze all your product attributes and the ability to slice and dice via any of the attributes.
It also comes with a rich reporting, dashboard and data visualization layer called Workspace. Planning Analytics Workspace delivers a self-service web authoring to all users. Through the Planning Analytics Workspace interface, authors have access to many visual options designed to help improve financial input templates and reports. Planning Analytics Workspace benefits include:
- Free-form canvas dashboard design
- Data entry and analysis efficiency and convenience features
- Capability to combine cube views, web sheets, text, images, videos, and charts
- Synchronised navigation for guiding consumers through an analytical story
- Browser and mobile operation
- Capability to export to PowerPoint or PDF
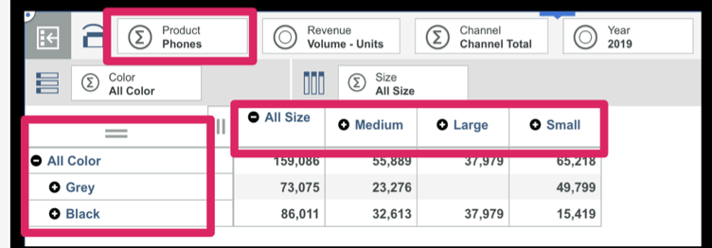
Source : Planning Analytics (TM1) cube

This Blog details IBM Planning Analytics On-Cloud and On-Premise deployment options. It focusses & highlights key points which should help you make the decision; “whether to adopt Cloud Or stay on Premise”
IBM Planning Analytics:
As part of their continuous endeavour to improve application interface and better customer experience, IBM rebranded TM1 to Planning Analytics couple of years back which came with many new features and a completely new interface. With this release (PA 2.x version as it has been called), IBM is letting clients choose Planning Analytics as Local SW or as Software as a Service (SaaS) deployed on IBM Softlayer Cloud.
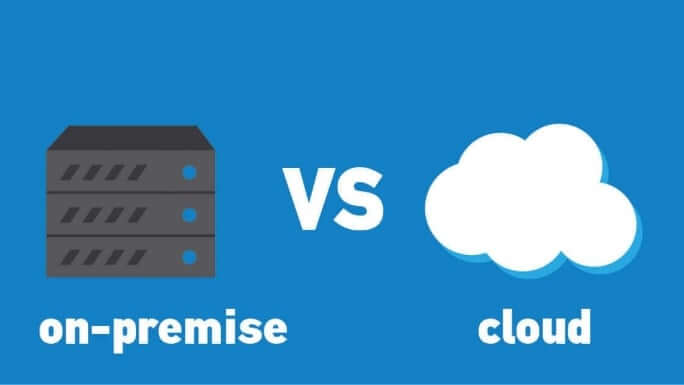
Planning Analytics on Cloud:
Under this offering, Planning Analytics system operates in a remote hosted environment. Clients who choose Planning Analytics deployed “on-cloud” can reap many benefits aligned to any typical SaaS.
With this subscription, Clients’ need not worry about software Installation, versions, patches, upgrades, fixes, disaster recovery, hardware etc.
They can focus on building business models and enriching data from different source systems and give meaning to the data they have. This by converting data into business critical, meaningful, actionable insights.
Benefits:
While not a laundry list, covers significant benefits.
- Automatic software updates and management.
- CAPEX Free; incorporates benefits of leasing.
- Competitiveness; long term TCO savings.
- Costs are predictable over time.
- Disaster recovery; with IBM’s unparalleled global datacentre reach.
- Does not involve additional hardware costs.
- Environment friendly; credits towards being carbon neutral.
- Flexibility; capacity to scale up and down.
- Increased collaboration.
- Security; with options of premium server instances.
- Work from anywhere; there by driving up productivity & efficiencies.
Client must have Internet connection to use SaaS and of course, Internet speed plays major role. In present world Internet connection has become a basic necessity for all organizations.
Planning Analytics Local (On-Premise):
Planning Analytics local essentially is the traditional way of getting software installed on company’s in-house server and computing infrastructure installed either in their Data Centre or Hosted elsewhere.
In an on-premise environment - Installation, upgrade, and configuration of IBM® Planning Analytics Local software components are on the Organization.
Benefits of On-Premise:
- Full control.
- Higher security.
- Confidential business information remains with in Organization network.
- Lesser vendor dependency.
- Easier customization.
- Tailored to business needs.
- Does not require Internet connectivity, unless “anywhere” access is enabled.
- Organization has more control over implementation process.
As evident on-premise option comes with some cons as well, few are listed below.
- Higher upfront cost
- Long implementation period.
- Hardware maintenance and IT cost.
- In-house Skills management.
- Longer application dev cycles.
- Robust but inflexible.
On-premise software demands constant maintenance and ongoing servicing from the company’s IT department.
Organization on on-premise have full control on the software and on its related infrastructure and can perform internal and external audits as and when needed or recommended by governing/regulatory bodies.
Before making the decision, it is also important to consider many other influencing factors; from necessary security level to the potential for customization, number of Users, modelers, administrators, size of the organization, available budget, long term benefits to the Organization.
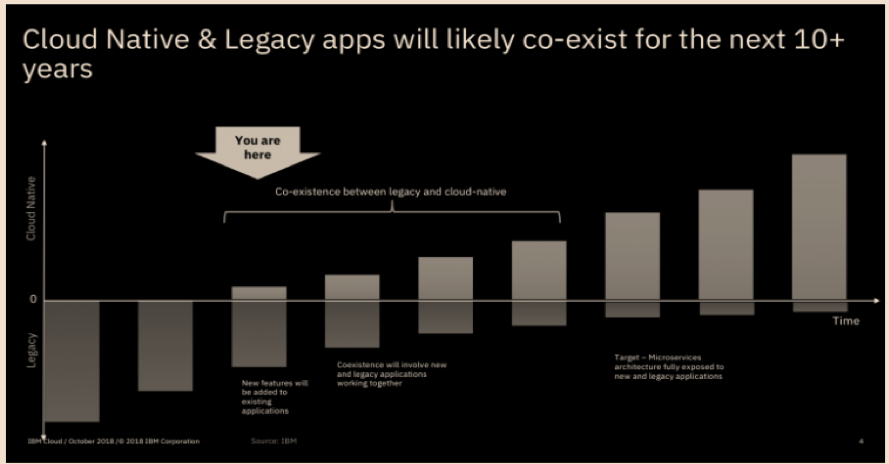
While you ponder on this, there are many clients who have adopted a “mid-way” of hybrid environment. Under which basis factors like workload economics, application evaluation & assessment, security and risk profiles, applications are being gradually moved from on-premise to cloud in a phased manned.
You may also like reading “ What is IBM Planning Analytics Local ” , “IBM TM1 10.2 vs IBM Planning Analytics”, “Little known TM1 Feature - Ad hoc Consolidations”, “IBM PA Workspace Installation & Benefits for Windows 2016”.
For more Information: To check on your existing Planning Analytics (TM1) entitlements and understand how to upgrade to Planning Analytics Workspace (PAW) reach out to us at info@octanesolutions.com.au for further assistance.
Octane Software Solutions Pty Ltd is an IBM Registered Business Partner specialising in Corporate Performance Management and Business Intelligence. We provide our clients advice on best practices and help scale up applications to optimise their return on investment. Our key services include Consulting, Delivery, Support and Training. Octane has its head office in Sydney, Australia as well as offices in Canberra, Bangalore, Gurgaon, Mumbai, and Hyderabad.
To know more about us visit, OctaneSoftwareSolutions.

There’s no question that more and more enterprises are employing analytics tools to help in their strategic business intelligence decisions. But there’s a problem - not all source data is of a high quality.
Poor-quality data likely can’t be validated and labelled, and more importantly, organisations can’t derive any actionable, reliable insights from it.
So how can you be confident your source data is not only accurate, but able to inform your business intelligence decisions? It starts with high-quality software.
Finding the right software for business intelligence
There are numerous business intelligence services on the market, but many enterprises are finding value in IBM solutions.
IBM’s TM1 couches the power of an enterprise database in the familiar environment of an Excel-style spreadsheet. This means adoption is quick and easy, while still offering you budgeting, forecasting and financial-planning tools with complete control.
Beyond the TM1, IBM Planning Analytics takes business intelligence to the next level. The Software-as-a-Service solution gives you the power of a self-service model, while delivering data governance and reporting you can trust. It’s a robust cloud solution that is both agile while offering foresight through predictive analytics powered by IBM’s Watson.

Data is only one part of the equation
But it takes more than just the data itself to make the right decisions. The data should help you make smarter decisions faster, while your business intelligence solution should make analysing the data easier.
So how do you ensure top-notch data? Consider these elements of quality data:
- Completeness: Missing data values aren’t uncommon in most organisations’ systems, but you can’t have a high-quality database where the business-critical information is missing.
- Standard format: Is there a consistent structure across the data – e.g. dates in a standard format – so the information can be shared and understood?
- Accuracy: The data must be free of typos and decimal-point errors, be up to date, and be accurate to the expected ‘real-world’ values.
- Timeliness: Is the data ready whenever it’s needed? Any delays can have major repercussions for decision-making.
- Consistent: Data that’s recorded across various systems should be identical. Inconsistent datasets – for example, a customer flagged as inactive in one system but active in another – degrades the quality of information.
- Integrity: Is all the data connected and valid? If connections are broken, for example if there’s sales data but no customer attached to it, then that raises the risk of duplicating data because related records are unable to be linked.
Are you looking to harness the power of your source data to make actionable business decisions? Contact Octane to find out how we can help you leverage your data for true business intelligence.


Smart businesses are seeking out new ways to leverage the benefits of their big data analytics programs, and the self-service model is coming up trumps. By placing the onus directly on business users, enterprises are empowering customers with insights-driven dashboards, reports, and more. But it’s not the only bonus.
Arguably an even greater upside for organisations is that it alleviates the talent shortage that often comes with big data. With most companies only employing a handful of data experts who can deliver analytics insights to customers, the self-service model means they are freed up to concentrate on more important tasks, while allowing the masses to derive their own insights on their own terms.
What are the real benefits of self service?
If nothing else, a self-service model creates a ‘democratisation’ of big data, giving users the freedom to access the data they need when they need it most: during the decision-making process.
Moreover, there’s a low cost to entry – coupled with reduced expenses thanks to freeing up data science and IT resources – and faster time to insight. When users know what they need and can change their research strategies according to new and changing demands, they become more empowered.
But it’s not all smooth sailing – giving customers the tools they need for self service is only one part of the equation. They must also be educated on the potential pitfalls.

Avoid the common hurdles
When several users have access to specific data, there’s a risk of multiple copies being made over time, thus compromising the ‘one version of truth’ and possibly damaging any insights that could be derived.
Business users unfamiliar with big data analytics are also prone to mistakes, as they may be unaware of data-preparation complexities – not to mention their own behavioural biases.
For all these issues, however, education is the solution, which is what Ancestry.com focused on when it began encouraging self-service analytics through its new data-visualisation platform. And with 51 quintillion cells of data you can see why.
There’s no harm in starting small with big data analytics
Ancestry.com has over 10 billion historical records and about 10 million registered DNA participants, according to Jose Balitactac who is the FP&A Application Manager.
The old application they were using was taking hours to do the calculations. They looked at seven different applications before deciding on IBM Planning Analytics.
The reason they chose IBM Planning Analytics was to accommodate the company’s super-cube of data, other solutions would have required them to “break it into smaller cubes, or reduce the number of dimensions, or join members, such as business units and cost centers.” They didn’t want to do that because their processes worked.
They set up a test with IBM to time how long it took for the model to calculate and it took less than 10-20 seconds which is what they wanted. You can read more about the Ancestry.com case study here.
If you’re keen to empower your business users through a self-service model, contact Octane today to learn how we can help you harness big data analytics.

we go the extra mile so you can go the distance|
Got a question? Shoot!
Lorem ipsum dolor sit amet, consectetur adipiscing elit, sed do eiusmod tempor incididunt ut labore et dolore magna aliqua.
.png)
.png)
.png)


.webp)


.png?width=673&height=371&name=IBM_Gold-removebg-preview%20(1).png)
Leave a comment