While reading the excerpts from various books and journals on science direct website, I couldn't help but start thinking of how IBM PA fares against these quality attributes of software, which has precisely led me to write this blog article hoping to share my thoughts with you. As I do this, I am also hoping that this will aid the CFOs and other decision-makers in choosing the right software for their organization based on these key traits.
Before we start talking about software quality attributes also known as SQA, let us first understand what it takes to assess the quality of any software.
"The abstract term of quality needs to be made tangible. To accurately assess the quality of software, one needs to differentiate between structural and functional quality (Balci, 1998)"
To assess the SQA, it must be measured on tangible factors. When it comes to structural quality, IBM PA's the-most-powerful backend engine with its solid framework and architecture has repeatedly established itself as a market leader in terms of the stability and the speed at which it operates.
Note that while there are other attributes that one can gauge the quality of software against, in this article, however, I am only going to rate and do a deep dive in 4 key attributes I find worth mentioning as follows:
Security and conformance to standards ⭐⭐⭐⭐⭐
Security and conformance are paramount for any software to be widely adopted as enterprise software. Maintaining the security and integrity of confidential customer data should be its top priority.
When it comes to conformance and compliance standards, IBM PA is ahead of its curve. It is GDPR (General Data Protection Regulation) ready for data protection and maintains extremely high standards around functionality, security, and certifications. It holds multiple ISO international certifications and has strict policies across data governance, information security, access controls, asset management and it is SOC - another international independent auditing body - compliant for the cloud.
The latest certifications achieved by Planning analytics can be found here.
Planning Analytics performs annual SSAE18 SOC external audits.
The Statement of Applicability that outlines the Domains, Control Objectives as well as various security controls that are in place for ISO including audit reports can be obtained by IBM through a formal request channel.
The PA data can be encrypted at REST for Local and although it's not currently supported for cloud offering, however according to IBM, it is provided as a part of it. TM1 API or TM1Crypt utility can be used by TM1 Admins to facilitate enabling and disabling server encryption. More on it can be found here.
Efficiency ⭐⭐⭐⭐
Efficiency is one driver that gives satisfaction to the customers and therefore it is increasingly important after functionality for any product to deliver true customer value. Some may share an opinion that some functionalities can be traded off with speed or performance, however the same cannot be argued for the latter.
When we talk about efficiency concerning Planning Analytics, it can be determined with the efficiency in terms of the speed and performance on below activities:
- Server start
- Data retrieval
- Data processed
- Reports refresh time
- Data entry Etc...
Traditional database software stores their data on disk in rows and columns, making it slow to query and perform data analysis, especially as data volume grows. Planning Analytics is built on a powerful in-memory engine that enables multi-dimensional analysis and exploration of the huge volume of past, current, and future financial data at a speed of light. Because it's in-memory, the data is stored in RAM instead of a hard disk for accessing it at a warp speed. It leverages a sparse consolidation algorithm to effectively perform sums at lightning speed by ignoring the null values in a cube.
It provides self-service and fast development and deployment of the models and because it is agile at its core, the changes to the model can be made quickly and easily to adapt to fast-changing market conditions.
Besides being in-memory, it also provides the multi-threaded processing of the data that uses multiple cores of the server to speed up the data reading and loading both.
In Planning Analytics for Microsoft Excel which is an Excel-based front end, the reports are designed to work even in a wide area network environment, without the need for Citrix without compromising on the performance.
Various configuration parameters such as MTQ (for multithreading the queries in separate cores), MTQQuery, PersistenFeeders, MTFeeder, MTFeeder.AtStartup etc can further be added to boost the performance outcome of the application.
Usability ⭐⭐⭐⭐⭐
Ease of Use plays a critical role in software user acceptance. A product is as good as its usefulness. Having all the utilities without usability leads to a failed product and the user adoption is severely impacted. A lot of times even the best software that delivers on both the functionality, as well as performance, fails to win the users primarily because it is too complex to use, or its features are not easy to learn and remember. Naturally, the users will lose interest over time and eventually stop using it.
IBM's Planning Analytics Workspace, a one-stop-shop for all activities from modeling to data entry, reporting, and analysis to environment administration, aims to enable the business to own and run it with limited or no IT involvement. The Hierarchy feature has opened a whole new landscape for analyzing data at the tip of the finger which required significant development effort and thought process before.
It has recently undergone a huge makeover and made several designs and UI changes in version 2.0.57 SC to make the end user's user experience of the platform more engaging and interactive, highlighting its commitment and continued investment in usability and putting users as the center of focus.
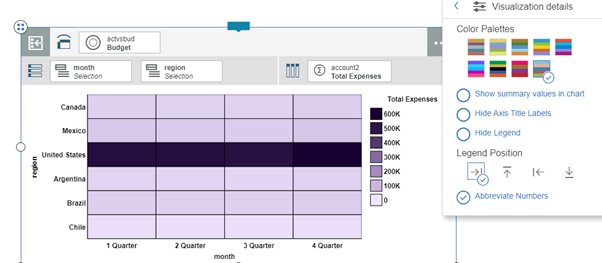
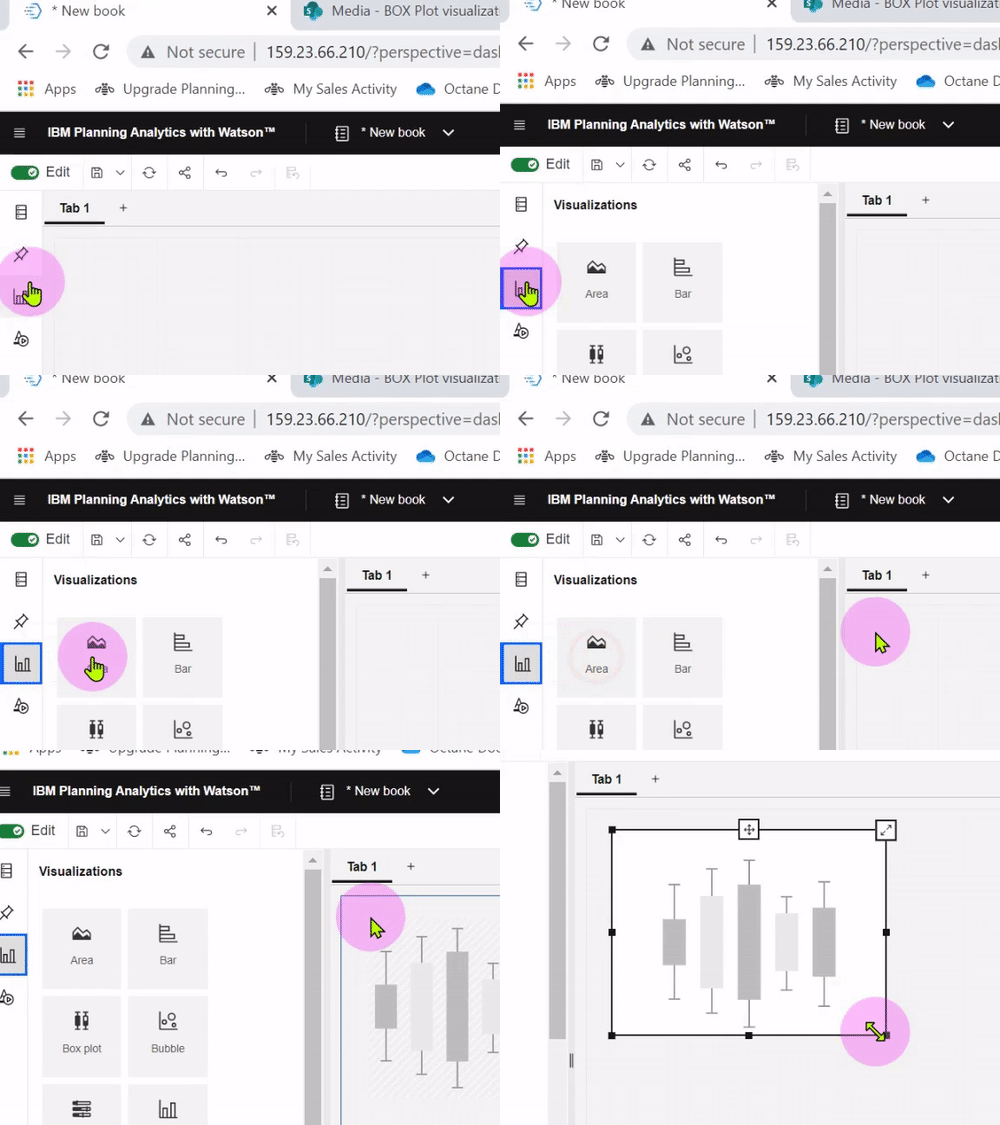
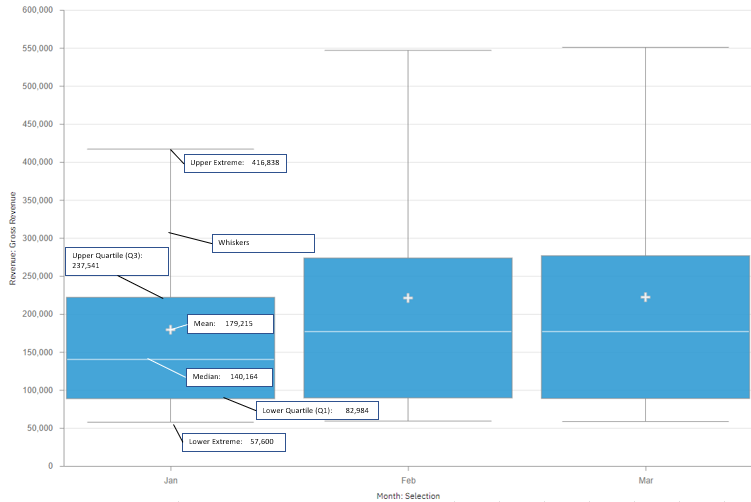
Several new and rich visualizations such as Box Plot, scorecards, and Waterfall charts have also been added. It now leverages its open-source carbon design principle throughout Planning Analytics Workspace.
It has also added the Guided Planning capability that allows organizing logically related Planning Analytics Workspace assets such as books, views, and web sheets in containers.
The cognitive help that PAW has is AI-based which is tailored based on where you are working within the interface and finds only the answers that are relevant to the specific user role. It includes the latest videos, blogs, and documentation.
Portability ⭐⭐⭐⭐⭐
In this attribute, IBM Planning Analytics scores 10 out of 10. Strong integration of PAW and PAFE has made IBM PA by far the most likable and adaptable application by the finance team. We all know how much Finance loves Excel and the relationship they have with it and it's not an exaggeration to say that it's quite personal. There is huge interoperability between PAW and PAfE which allows the users to flip between the two interfaces without losing the capabilities it offers.
The adaptiveness of the software can be further established by the fact that it cannot only be deployed on local or on-cloud environments but also on hybrid environments as well and is available on single and multi-tenant environments as well. Due to the ease of maintenance where once the models are developed, it is completely owned and run by finance, IBM PA has become the tool of choice for many organizations that seek control over the operations of their applications.
In conclusion, IBM Planning Analytics checks all the boxes that enterprise software is expected to have for it to be selected as a primary solution for planning, budgeting, forecasting, and financial consolidations with an overall rating of not less than 4.5 out of 5 concerning how it compares to at least 4 key software quality attributes.
While reading the excerpts from various books and journals on science direct website, I couldn't help but start thinking of how IBM PA fares against these quality attributes of software, which has precisely led me to write this blog article hoping to share my thoughts with you. As I do this, I am also hoping that this will aid the CFOs and other decision-makers in choosing the right software for their organization based on these key traits. Before we start talking about software quality attributes also known as SQA, let us first understand what it takes to assess the quality of any software. ...


.webp) 0
0
.webp) 3 March 2022, 2:15:12 pm AEDT
3 March 2022, 2:15:12 pm AEDT
.webp) 4 min
4 min
.webp)







.jpg?width=684&height=385&name=Dynamic%20Array%20Formulas%20in%20IBM%20PA%20TM1%20(1).jpg)