<img src="https://trc.taboola.com/1278851/log/3/unip?en=page_view" width="0" height="0" style="display:none">
finding octane
Content_Cut_Icon Twitter_Brands_Icon

Adding images in PAW

Mode_Comment_Icon_white1
Alarm_Icon_1_white5 min

In this article I would like to share a very useful tip on how we can use different methods to adding images in Planning Analytics Workspace; one that is very well known, one that is lesser-known and one that is relatively unknown. I intend to touch base on the first two methods while focusing more on the latter one. But before I begin, as I write this blog article, there has been more than 2 ...

down-arrow-blue
Book_Open_Solid_Icon

In this article I would like to share a very useful tip on how we can use different methods to adding images in Planning Analytics Workspace; one that is very well known, one that is lesser-known and one that is relatively unknown. I intend to touch base on the first two methods while focusing more on the latter one. 

But before I begin, as I write this blog article, there has been more than 2 million confirmed cases of COVID-19 worldwide with over 130,00 deaths and I wish to take a moment on behalf of Octane Software Solutions and express our deepest condolences with all those and their family members who have directly or indirectly suffered and had been affected by the pandemic and our thoughts go to them. 

And at the same breath a special shout out and our gratitude to the entire medical fraternity, the law enforcement, various NGOs and numerous other individuals, agencies and groups both locally and globally who has been putting their lives at stake to combat this pandemic and help the needy around. Thank you to those on the frontline and the unsung heroes of the COVID-19. It is my firm belief that together we will succeed in the fight.

Back to the topic, one of the most used methods for adding images in PAW is to upload it in some content management and file sharing sites like BOX or SharePoint and paste the web link in the PAW Image Url field. Refer the link below where Paul Young demonstrates how to add an image using this method. 

The other method is to upload your image to an encoding website like https://www.base64-image.de.

This provides a string which can then be pasted as Image url to display the image. Note that it only works on limited file formats and on small sized images.

Also note that albeit the above two methods achieves the purpose of adding images in PAW none of them provides the capability to store the images in a physical drive in order to keep a repository of the images used in PAW easily saved and accessible in your organizations’ shared drive.

The third approach addresses this limitation as it allows us to create a shared drive, store our images in it and then reference it in PAW.

This can be done by creating a website in IIS manager using few simple steps as listed below.

First off, before you can begin, ensure IIS is enabled in your data server as a prerequisite step. This can be done by simply searching IIS in your Windows menu. 

Screen Shot 2020-04-21 at 7.59.26 am

Incase no results are displayed, it means it has not been enabled yet. 

To enable, go to Control Panel à Programs à Turn Windows feature on or off

A wizard opens, click Next. Select Role-based or feature-based installation and click Next.

Screen Shot 2020-04-21 at 7.59.47 am

Select the server if its not already selected (typically data server where you’re enabling the IIS)

Select the Web Server check box and click Next

Screen Shot 2020-04-21 at 8.01.46 am-1


Select IIS Hostable Web Core and and click Install.

Image 3-1


This installs the required IIS components on the server so we can now proceed to add the website in IIS Manager.

Before adding a website, navigate to C:\inetpub\wwwroot\ and create a folder in this directory. This will be the folder where we will store our images.

Once IIS is enabled follow the below steps:

1. Under Sites right click and select Add Website.

Screen Shot 2020-04-21 at 8.02.14 am


2. Update the following configuration settings

a. Site name: Enter the name of the site

b. Physical path: Enter the folder path we created in earlier step

c. Port: Enter any unreserved port number

d. Host name: Enter the machine name


Screen Shot 2020-04-21 at 8


Now go to PAW and enter the image URL.

Image 4-1


Where ibmpa.jpg is the image saved within PAWImage folder.

Note: This only works in Planning Analytics Local.


Octane Software Solutions is a IBM Gold Business Partner, specialising in TM1, Planning Analytics, Planning Analytics Workspace and Cognos Analytics, Descriptive, Predictive and Prescriptive Analytics.


Try out our TM1 $99 training 
Join our TM1 training session from the comfort of your home

find out more


Leave a comment

Line

Saying Goodbye to Cognos TM1 10.2.x: Changes in support effective April 30, 2024

Mode_Comment_Icon_black0
Alarm_Icon_12 min

In a recent announcement, IBM unveiled changes to the Continuing Support program for Cognos TM1, impacting users of version 10.2.x. Effective April 30, 2024, Continuing Support for this version will cease to be provided. Let's delve into the details.

blog (1)

What is Continuing Support?

Continuing Support is a lifeline for users of older software versions, offering non-defect support for known issues even after the End of Support (EOS) date. It's akin to an extended warranty, ensuring users can navigate any hiccups they encounter post-EOS. However, for Cognos TM1 version 10.2.x, this safety net will be lifted come April 30, 2024.

What Does This Mean for Users?

Existing customers can continue using their current version of Cognos TM1, but they're encouraged to consider migrating to a newer iteration, specifically Planning Analytics, to maintain support coverage. While users won't be coerced into upgrading, it's essential to recognize the benefits of embracing newer versions, including enhanced performance, streamlined administration, bolstered security, and diverse deployment options like containerization.

How Can Octane Assist in the Transition?

Octane offers a myriad of services to facilitate the transition to Planning Analytics. From assessments and strategic planning to seamless execution, Octane support spans the entire spectrum of the upgrade process. Additionally, for those seeking long-term guidance, Octane  Expertise provides invaluable Support Packages on both the Development and support facets of your TM1 application.

FAQs:

  • Will I be forced to upgrade?

    No, upgrading is not mandatory. Changes are limited to the Continuing Support program, and your entitlements to Cognos TM1 remain unaffected.

  • How much does it cost to upgrade?

    As long as you have active Software Subscription and Support (S&S), there's no additional license cost for migrating to newer versions of Cognos TM1. However, this may be a good time to consider moving to the cloud. 

  • Why should I upgrade?

    Newer versions of Planning Analytics offer many advantages, from improved performance to heightened security, ensuring you stay ahead in today's dynamic business environment. This brings about unnecessary risk to your application.

  • How can Octane help me upgrade?

    Octane’s suite of services caters to every aspect of the upgrade journey, from planning to execution. Whether you need guidance on strategic decision-making or hands-on support during implementation, Octane is here to ensure a seamless transition. Plus we are currently offering a fixed-price option for you to move to the cloud. Find out more here 

In conclusion, while bidding farewell to Cognos TM1 10.2.x may seem daunting, it's also an opportunity to embrace the future with Planning Analytics. Octane stands ready to support users throughout this transition, ensuring continuity, efficiency, and security in their analytics endeavours.

Line

Unlocking the Power of Hierarchies in IBM Planning Analytics

Mode_Comment_Icon_black0
Alarm_Icon_14 min

With the introduction of hierarchies in IBM Planning Analytics, a new level of data analysis capability has been unlocked. This is by far one of the most significant enhancements to the Planning Analytics suite as far as the flexibility and usability of the application is concerned.

IBM Planning Analytics

Benefits of LEAVES Hierarchy

One particular useful hierarchy is the LEAVES hierarchy. It offers several benefits beyond data analysis. 

One that stands out is that it is a “zero-maintenance” hierarchy as it automatically adds leaf level members as they are added in other hierarchies. It can also be used as a master hierarchy to validate and compare nLevel members in all the other hierarchies. Additionally, deleting the member from this hierarchy will delete it from the rest of the hierarchies.

While all hierarchies must be either manually created or automated through the TI process, contrary to the general perception within the PA community where it is maintained that LEAVES hierarchy only gets added when you create a new hierarchy in a dimension, there is, however, a quick and easy way to create the LEAVES hierarchy without creating any other hierarchy in few simple steps. 

}DimensionProperties cube

This is where, where I would like to expose you to a control cube - }DimensionProperties. In this cube you will find quite a few properties that you can play around with. Two properties to focus in this blog are “ALLLEAVESHIERARCHYNAME” and “VISIBILITY”. 

Creating LEAVES hierarchy

By default, the value for ALLLEAVESHIERARCHYNAME in the control cube is blank, however, entering any name in that cell against a corresponding dimension will automatically create a LEAVES hierarchy with that name. 

ezgif.com-video-to-gif

Once done, the Database Tree must be refreshed to see the leaves hierarchy reflecting under the dimension.

This way you can quite easily create the LEAVES hierarchy for any number of dimensions by updating the values in }DimensionProperties cube.

Caution: If you overwrite the name in the control cube, the LEAVES hierarchy name is updated with the new name in the Database Tree and if your old LEAVES hierarchy is referenced in any rules, process or views and subsets, they will no longer work. However, once you restore the original name in the control cube, it will start working. This risk can be mitigated by using a consistent naming convention across the model.

Note that the old hierarchy will still remain in the ‘}Dimensions’ dimension and changing the name does not automatically delete the old hierarchy member.

ezgif.com-optimize

Toggling Hierarchies

In addition to creating LEAVES hierarchy using a few simple steps, you can also use the }DimensionProperties cube to hide or unhide any hierarchy you have created. This capability is useful if there are many hierarchies that have been created but only a selected few needs to be exposed to the users. If any of the hierarchy is not yet updated and is still in WIP state, it can be hidden until the changes are finalized. This gives more control to the administrators or power users to hide or unhide whichever hierarchy they like to show.

To hide any hierarchy, enter the value NO against the “Visibility” property in the control cube. Once the Database Tree is refreshed, that hierarchy will no longer be visible under the dimension. This property is also blank by default.

ezgif.com-optimize (1)

If a view contains a hierarchy and the VISIBILITY property of that hierarchy is set to NO, while the view still opens, opening the subset editor will throw an error.

Note, to unhide the hierarchy, delete the value or enter YES and refresh the Database Tree.

In conclusion, once you understand the benefits and take into account the potential pitfalls of updating the properties, using this capability would greatly enhance the overall usability and maintainability of the application. 

Line

DYNAMIZING DYNAMIC REPORTS: A Hack to Make Columns as Dynamic as Rows

Mode_Comment_Icon_black0
Alarm_Icon_14 min

If you’re tired of manually updating your reports every time you need to add a new column in your Dynamic Reports, you're not alone. It can be time-consuming and tedious - not to mention frustrating - to have to constantly tweak and adjust your reports as your data changes. Luckily, there’s a way to make your life easier: Dynamizing Dynamic Reports. By using a hack to make your reports’ columns as dynamic as the rows, you can free up time and energy for other tasks - and make sure your reports are always up-to-date. Read on to learn how to make your reports more dynamic and efficient!

The Good

Dynamic Reports in PAfE is highly popular and primarily used due to its intrinsic characteristic of being dynamic. The great thing about this report and one of the big reasons for its wide adoption is that the row content in this report updates dynamically, either depending on the subset used or the mdx expression declared within the TM1RptRow function and also because the formulas in the entire TM1RPTDATARNG are dictated by simply updating them in the master row (first row of data range) and it cascades down automatically, including how the formats of the reports are dynamically applied in the report.

The Bad

That being said, with all those amazing capabilities, there is however one big limitation of this report and that is that, unlike rows, the columns are still static and require the report builder to manually insert the elements and the formulas across the columns, thereby making it “not so dynamic” as you would otherwise expect, in that context.

Purpose of this blog

And it is precisely this limitation that this blog aims to address and provide you with a workaround to this problem and make the columns as dynamic as the rows, thus substantiating the title of the blog “Dynamizing the Dynamic Report”.

Method

In order to achieve the dynamism, I have primarily used a combination of 4 functions; 3, Excel 365 and 1, PAfE Worksheet function and they are as follows:

  1. BYCOL - processes data in an array or range and leverages LAMBDA function as an argument to each column in the array to return one result per column as a single array

  2. LAMBDA - a UDF (user defined function) helps to create generic custom functions in Excel that can reused by either embedding it as an argument in another LAMBDA supported function (such as BYCOL) or a function of its own when ported as a named range

  3. TRANSPOSE - Dynamic Array function to transpose the row or column array

  4. TM1ELLIST - Only PAfE worksheet function that returns an array of values from a dimension subset, static list or MDX expression

Instructions

Let's have a look now at how we have utilized these functions within the Dynamic Report.

The above image is a Dynamic Report showing the data from the Benefits Assumptions cube having 3 dimensions; Year, Version, and Benefit.

The Benefit dimension is across rows, Year across columns, and Version on the title.

In cell C17, I used the TM1Ellist function to get the Year members (Y1, Y2, Y3) from a subset named “Custom Years” returning it as a range and then wrapping it inside the TRANSPOSE function to transpose the resultant range.

Cell C17 formula:

In cell C18, instead of DBRW, I used the BYCOL function where I used the range in cell C17 by prefixing it with spilled reference (#) as the first argument of it.

I then used the LAMBDA function to create a custom function as its second argument where I declared a variable x and passed it inside the DBRW formula in the position of the Year dimension.

So the way the formula would work is, it would take the output from TM1ELLIST function and pass each member of it in LAMBDA function as variable x which is then passed within DBRW formula, making it a dynamic range that automatically resizes based on the output of TM1ELLIST function.

Cell C18 formula: 

Lightbulb_Solid_Icon

Note that the formula is only entered in one cell (C18) and it spills across both rows and columns.

Caveats

  1. This is only supported in PAfE which means it won’t work in PAW or TM1Web

  2. Works in Excel that supports Dynamic Array and LAMBDA functions

  3. The formatting is not spilled


Line

Octane Software Solution Partner With QUBEdocs to Deliver Cutting Edge

Mode_Comment_Icon_black0
Alarm_Icon_13 min

Octane Software Solutions is a cutting edge technology and services provider to the Office of Finance. Octane is partnered with vendors like IBM and BlackLine to provide AI-based solutions to help finance teams automate their processes and increase their ability to provide business value to the enterprise.

Qubedocs is an automated IBM Planning Analytics documenter. It generates automated documentation within minutes and ensures compliance and knowledge management within your organisation. So, we're excited to announce our partnership with QUBEdocs - a solution that takes the resources and headaches out of TM1 modelling. In this article, we discuss common challenges with Planning Analytics and how QUBEdocs transforms this process.

Challenges with Planning Analytics (TM1)

Our experience in the industry has meant we've worked with many enterprises that encounter challenges with Planning Analytics. Common concerns and challenges that our clients face are listed here:

  • Correct documentation
  • Over-reliance on developers, which leaves businesses vulnerable.
  • Unable to visualise the full model, resulting in not understanding the information and misinterpreting the model.
  • Are business rules working correctly?
  • Understanding data cubes
  • Disaster recovery and causation analysis
  • Managing audit
  • Compliance with IBM licence rules

Reading through these challenges can paint the picture of a complicated process to manage and support. They cover a broad range of concerns, from first ensuring the documentation is correct, understanding the data and information, and not knowing if they're doing it right. Automating this process can take the guesswork and lack of confidence out of the models.

How QUBEdocs transforms the process

We've partnered with QUBEdocs because of its capabilities to transform the TM1 Models. Through QUBEdocs you can generate custom documentation in minutes (as opposed to months) for your IBM Planning Analytics TM1. You're able to meet your regulatory requirements, capture company-wide knowledge and gain an accurate, updated view of TM1 model dependencies.

Below is a list of benefits that QUBEdocs offers:

Purpose-built

Specifically built for business intelligence, QUBEdocs allows seamless integration with IBM Planning Analytics.

Fully automated documentation

QUBEdocs focuses on driving business value while documenting every single detail. Automating the documentation takes the errors out of the process and ensures your plans are knowledge-driven.

Personalised reporting

QUBEdocs keeps track of all the layers of data that are important to you – choose from standard reporting templates or customise what you want to see.

Compare models

Compare different versions of your model to gain complete visibility and pinpoint changes and potential vulnerabilities.

Cloud-based

QUBEdocs up-to-date features and functionalities need no infrastructure to use and allows collaborative, remote working.

Data with context

Context is critical to data-driven decisions. Every result in QUBEdocs is supported by context, so you understand before you act.

Model analysis 

Models offer a way to look at your applications, objects or relationships in-depth. Analysing your models can help you understand your complex models intuitively, so you know each part of your business and what it needs to succeed.

Dashboards 

Understand your server environment at a glance with key metrics tailored for different stakeholders in your business.

Summary

This article has outlined the benefits of QUBEdocs, and why we're excited to announce our partnership. Though, when you work with Octane Software Solutions, you get a company in it for the long haul until you've grown into your new wings. If QUBEdocs is right for you, a big part of our processes is implementing it into your organisation so that it's fully enabled to improve your business performance. 

Learn more about QUBEdocs or join our upcoming webinar; How to automate your Planning Analytics (TM1) documentation.

Line

Planning Analytics with Watson (TM1) Training made easy

Mode_Comment_Icon_black1
Alarm_Icon_14 min

We have made it easier for your users to access Planning Analytics with Watson (TM1) Training.


This week we launched our online training for Planning Analytics with Watson PAW and PAX; available online in instructor-led, 4-hour sessions. 


Planning Analytics with Watson (TM1) Training

This training provides the ideal time for you to spend some of your allocated training budgets; often assigned but never utilised on something that you can actually apply in your workplace. We have made it easy for you to book your training online in a few easy steps.

IBM has been consistently improving and adding new features to PAW and PAX. To maximise your training outcome, we will run the training on the latest (or very close to the latest) release of PAW and PAX; which will give you a good insight into what new features are available. Our training will speed up your understanding of the new features and help you decide on your upgrade decisions. The best part of our training offering is that we have priced it at only $99 AUD – this is a great value.

Being interactive instructor-led TM1 training, you would be able to ask questions and get clarifications in real-time. Attending this training will ensure that you and your staff are up-to-date with the latest versions and functionalities.


Training outcomes

Having your users trained up will mean that you can utilise your Planning Analytics with Watson (TM1) application to its full potential. Users would be able to self service their analytics and reporting. They would also be logging a reduced number of tickets as they understand how to use the system. Engagement would go up as they actively participate in providing feedback on your model's evolution. Overall, you should expect to see an increase in productivity from your users.


PAW Training Overview
  • Introduction of PA and workspace
  • Welcome page
  • Creating books
  • Creating views
  • Hiding row or columns/rows and columns in views
  • Snap commands
  • Selector widget
  • Synchronising objects in a book or sheet
  • Adding navigation button to sheet
  • Dataset export
  • Visualisations
  • Creating metric visualisations
  • Add text box
  • Work with images
  • End-user calculations
  • Using MDX based subsets
PAX Training Overview
  • Introduction to PAX
  • Overview and list components
  • Setup IBM connection, connecting data source, open workbook
  • Working with data and reports
  • Clear cell content
  • Convert dynamic data to snapshots
  • Exploration views
  • Lists
  • Quick report
  • Dynamic report
  • Custom report
  • Publish workbooks
  • Sets for TM1
  • IBM TM1 functions
  • Cube viewer
  • Action buttons


Training delivery

The training course will be delivered online by Octane senior consultants, who have more than 10-15 years of delivery experience. The class size is limited to only 12 attendees to ensure all attendees get enough focus. 

The training sessions are scheduled in multiple, so you should be able to find a slot that is suitable for you


Have you got any questions?

We have captured most of the questions we've been asked on this FAQ page

I look forward to seeing you at training. 

Line

What's in a name? Watson in the name!

Mode_Comment_Icon_black0
Alarm_Icon_12 min

Starting 1 April 2021, "with Watson" will be added to the name of the IBM Planning Analytics solution.

IBM® Planning Analytics with Watson will be the official product name represented on the IBM website, in the product login and documentation, as well as in marketing collateral. However, IBM TM1® text will be maintained in descriptions of planning analytics' capabilities, differentiators and benefits.


What is the "Watson" in Planning Analytics with Watson?

The cognitive help feature within Planning Analytics with Watson is the help system used in IBM Planning Analytics Workspace (Cloud). This feature uses machine learning and natural language processing to drive clients towards better content that is more tailored to the user's needs. As clients interact with the help system, the system creates a content profile of the content they are viewing and what they are searching for.


Branding benefits of the name

  • Utilize the IBM Watson® brand, a leader in the technology and enterprise space, to gain a competitive advantage
  • AI and predictive as differentiators to how we approach planning
  • Amplify the reach of planning analytics to our target audience and analysts through Watson marketing activities


What do we think?

We are pleased to note that the name TM1 remains with the product. The Planning analytics product has evolved significantly from the early days of Applix. We had initial apprehension when IBM acquiring TM1 via Cognos acquisition (IBM acquired Cognos in January 2008 for USD $4.9 Billion). We naturally assumed that this little gem of a product would be lost in the vast portfolio of IBM software.

However, it's quite pleasing to see TM1 thrive under IBM. It received significant R&D funding and made TM1 into an enterprise planning tool. We saw the development of the workspace, which brought in the modern dashboard and reporting features. Move to Pax saw us get an even better excel interface and, just lately, the workspace feature that manages a complex enterprise workflow.

The biggest gamechanger was making Planning Analytics available as a Software as a Service (you can still get it as an on-premise solution). This meant that the time to deploy was reduced to a couple of days. There is no cost to the business in maintaining the application in doing any patches and upgrades. Gone are the days of IT and Finance at loggerheads over the application. The stability and speed of Planning Analytics as a SaaS product has pleasantly surprised even us believers!

Adding Watson to the name is timely as AI-infused features around predictive forecasting is getting more prevalent. There is no doubt that IBM Planning Analytics with Watson is the most powerful AI-based Planning tool available. It's time to acknowledge the future of where we are going.

What do you think of the name change? Share with us your thoughts.


Line

Data Analysis using Dynamic Array formulas

Mode_Comment_Icon_black0
Alarm_Icon_16 min

How to create reports using dynamic array formulas in Planning Analytics TM1


In our previous blog (https://blog.octanesolutions.com.au/what-are-dynamic-array-formulas-and-why-you-should-use-them), we discussed about Dynamic Array formulas and highlighted the key reasons and advantages to start using DA formulas.

In this blog, we will try to create a few intuitive reports based on custom reports built on PAfE. The data set we will be using is shows the employee details in “Employee” cube with the following dimensionality:


Dimension Measure
Year  Department
Version Name/Desc
Sr.No Current Salary
Organisation Joining Date
Measure  


Below is the screenshot of my PA data that I will be using for this blog:


Integration-Data


For ease of formula entry, I’ve created a named range for column B to F.


Integration-Data


Now that we’ve set the base, lets start off with generating some useful insights with our dataset.

  1. Get the employees with top/bottom 3 salaries
  2. Sum data based on date range
  3. Create searchable drop down list


Integration-Data


Formula in cell J22 is as below:


Integration-Data


I will try to breakdown the formula to explain in simple language:

We used Filter function which is a DA formula. The Excel FILTER function filters a range of data based on supplied criteria, and extracts matching records. It works in a similar way to VLOOKUP except that VLOOKUP returns a single value, whereas Filter returns one or more values that qualify a criteria. Filter takes three arguments; Array, Include and If_Empty. We passed the employee and salary list as the array in our formula and for inclusion we used a LARGE function (that returns the x largest value in an array where x is a number) and compared it with all the salaries using greater than or equal to operator.

With this criteria, the array is filtered to those employees whose salary is greater than or equal to the 3rd most largest salary.

Similarly, if you wish to filter the employees by 3 lowest salaries. Use the below formula to achieve the same:


Integration-Data


A very common analysis that is done based on date range is summarising or calculating the average of data between start and end date. So lets see how we can achieve this using the DA formula. The scenario is, the analyst wants to see what is the sum of the salaries paid for all the periods between Jan 2019 till Dec 2019.

Lets first get the list using the Filter function and once we’ve the data, it is very easy to just summarise it.


Integration-Data


Formula in cell H22 is as below:


Integration-Data


The concept is similar to the previous one where we’re getting a list of employees with their salaries and joining dates, based on a set condition. Here we’re using AND condition to filter the data based on two date ranges, where joining date of employees is greater than or equal to Date From and less than or equal to To Date. We had to use the NUMBERVALUE function to convert the date that is stored as string data in Planning Analytics to numeric value for doing logical comparison.

Now that we know we can apply the same condition within the Filter function that only returns the Salary and wrap it up inside the SUM function to summarise the salaries.


Integration-Data


Formula in cell L19:


Integration-Data


In PAfE, a SUBNM is used to search and select the elements in a dimension. However, there is currently no provision to filter the list of elements in SUBNM list to only show selected elements basis that matches the text, let alone wild card search. One of the cool things we can do with DA formulas is to be able to create a searchable drop down list.

Lets create a searchable drop down list for the Department now and see how it works.


Integration-Data


In the screenshot above, I’ve entered letter i in cell H7 which is a Data Validation list in Excel and the drop down lists all the departments which have letter i in it. The actual formula is written in cell I1 and that cell is referenced in the Source field of Data Validation.


Integration-Data


I’ve used a Hash(#) character in the source to refer to an entire spill range that the formula in I1 returns.

Formula in cell I1:


Integration-Data


I’ve wrapped a Filter function within a UNIQUE function that is another DA function that returns a unique list of values within an array. The Filter function uses SEARCH function to return a value if a match is found which is then wrapped inside ISNUMBER to return a Boolean value.

Note:: While the example uses custom report, the same named ranges can very well be created in Dynamic report using OFFSET function to do the same so this analysis is not just restricted to sliced report but also Dynamic aka Active Form report.


So these are just a few of the super easy and on the fly analysis we can do using DA functions to start with that can take the reporting capabilities of PAfE to a whole new level.


Line

Dynamic Array formulas in IBM PA TM1 - Supercharge your Excel report

Mode_Comment_Icon_black1
Alarm_Icon_14 min

Dynamic Array Formulas in IBM PA TM1 (1)


What are Dynamic Array formulas and why you should use them?


In this blog article (and few other upcoming blogs), I am going to write about the capabilities of Dynamic Array (DA) functions with examples and demonstrate to you some great features it has that I believe can empower the PA Analysts to do all differently sorts of data analysis in a simpler and much more intuitive way, thereby enhancing their productivity.

To start off, lets first understand what Dynamic Array functions actually are?

To put it simply, the DA functions are those functions that leverages Excel’s latest DA calculation behavior where you no more have to enter CSE(Control+Shift+Enter) to spill the formulas or in fact copy pasting the formula for each value you wanted returned to the grid.

With DA you simply enter the formula in one cell and hit enter and it will result in an array of values returned to the gird, also known as spilling.

The Array functions are currently only supported in Office 365 but according to Microsoft, it will be extended other versions soon.

Typically when you enter a formula that may return an Array in Older version of Excel and then open it in DA version of Excel, you would get an @ sign – also know as implicit intersection - before the formula. This is added by Excel automatically for all the formulas that it considers might potentially return an multi-cell ranges. By having this sign, Excel ensures formulas that can return multiple values in DA compatible version would always return just one value and it does not spill.

Following is the information on implicit intersection available on the Microsoft website:

With the advent of dynamic arrays, Excel is no longer limited to returning single values from formulas, so invisible implicit intersection is no longer needed. Where an old Excel formula could invisibly trigger implicit intersection, dynamic array enabled Excel shows where it would have occurred. With the initial release of dynamic arrays, Excel indicated where this occurred by using the SINGLE function. However, based on user feedback, we’ve moved to a more succinct notation: the @ operator.

Note: According to Microsoft, this shouldn’t impact the current formulas, however few Planning Analytics clients have already complained of issues having @ in DBRW formulas in PAfE where it no more works. The @ sign that had to be manually removed from all DBRW formulas to make it work. This is a bit of bummer because depending on the number of reports, it may lead to significant amount of work to do this task, a VBA might be a of relief here otherwise it a bit of tedious task.

More on Implicit Intersection can be found in below link:

https://support.microsoft.com/en-us/office/implicit-intersection-operator-ce3be07b-0101-4450-a24e-c1c999be2b34?ui=en-us&rs=en-us&ad=us

Additionally, there is another key update that must be made in Excel setting to address another bizarre side effect of implicit intersection observed in Dynamic reports. See below link for details:

https://www.ibm.com/support/pages/unable-expandcollapse-tm1rptrow-dynamic-report-shows-mail-icon

Below are the list of DA formulas currently available in Excel 365.

FILTER

RANDARRAY

SEQUENCE

SORT

SORTBY

UNIQUE

I will be covering off a bit more in detail on these functions in my subsequent blogs to showcase real power of these functions so hang in there till then.

As for why you need to use them, below are some of the reasons I’ve listed to bring on the table:

1. It compliments the PAfE capabilities and fills the gaps where PAfE could not due to its limitations

2. Can open up the world of new data analysis capabilities

3. Once you understand the formulas and the Boolean concept (which is not complicated by any means), It’s true potential could be realised

4. It is simple yet very powerful and a big time-saver

5. With formula sitting only in one cell, it is less error prone

6. The calculation performance is super-fast

7. CSE no more!

8. It is backward compatible, meaning you need not worry how your DA results appear in legacy excel as long as you’re not using the DA fun

9. Updates are easy to make – need to only update in once cell as opposed to all cells

This is my value proposition for why you should use DA formulas. I’ve so far not yet demonstrated what I proposed which I intend to do in my later blogs, till then thanks for reading folks and stay safe.

 link to youtube


Line

Octane Celebrates 4th Anniversary

Mode_Comment_Icon_black0
Alarm_Icon_16 min

2020 has been an interesting year for us !


204th 20annivesary


Image 3

Celebrations

This month Octane celebrates our 4th anniversary. Never imagined that we would be celebrating with our team members across different geographies via online gifts and Teams meetings. Normally we fly in all our team members to one location for the weekend and have a great time bonding. However with the global pandemic we had to adapt as the rest of the world is.

The journey so far

On the whole, reflecting back on the journey so far on our anniversary 2020 certainly has thrown in an riveting challenge. Having started from a small shared office in North of Sydney, Octane today has 7 offices and operates in multiple countries. We were helping some of the largest and diverse enterprises around the world get greater value out of their Planning Analytics applications. Travel to client sites in different cities was always been my favourite job perks. As we were getting into the grips of pandemic in Feb/march we were on a trip to Dubai and Mumbai meeting clients and staff. There was a bit of concern in the air but none of us had any idea that travel would come to a standstill. We suddenly found ourselves coordinating with our staff, arranging for their travel safely back to their homes; Navigating the multiple quarantine regimes of different countries and fighting for seats on limited flights.


Octane 4th annivesary Blog-1
Octane Team at client site in Dubai


Blog
Dubai Mall - One of our clients


20190908_111932-1
One of the team outings in Delhi

We had a team of consultants assisting Fiji Airways with their Finance Transformation. The travel restrictions and a volatile economy meant that Fiji Airways had to swiftly change gears and make use of our team to assist in business scenario planning and modelling. This was a exemplary example  of how a organisation reacted quickly and adopted a distinct business model to face the challenges. Thankfully their platform supported Scenario Modelling and could handle What-if Analysis handling at scale with ease (same cannot be said for some of the other enterprises that had to resort to excel or burn midnight oil to provide the right insights to the business - This is why we love Planning Analytics TM1!)


Blog-3
Fiji Airways (our client) on Tarmac at Nadi Airport


204th-20annivesary
Sameer Syed at the Welcoming ceremony of Fiji Airways A350 aircraft

The Silver Lining for Octane

With Pandemic came a rapid rethink of the business model for most organisations. We at Octane were already geared up to provide remote development and support of TM1 applications. With our offshore centres and built-in economies of scale, we were in a position to reduce the overall cost of providing development and support. This gained a lot more traction as organisations started evaluating their costs and realised we are able to provide better quality of services at a lower cost without a hitch. We internally tweaked our model to reduce barriers of entry for companies wishing to take up our Managed Service options. We already had a 24/7 Support structure in place which meant that we could provide uninterrupted service to any client anywhere in the world in their time zones.

Within Octane we were also operating in a crisis mode with daily Management calls. Ensuring safety and well-being of staff was our first priority as different countries and cities brought in the lockdowns. We remained agile and forged tactical plans with clients to ensure there were minimal disruptions to their business. Working from home was the new normal. We already had all the technology to support this and specialise in remote support so this was an fairly easy exercise for us.From the lows in May, Slowly but steadily our business model started to gain traction as we focused on client service and not profits.

Growth Plans and Announcements

In the chaos of 2020 it was also important to us to continue with our growth plans. We had to tweak our strategy and put opening new offices on hold in some countries.Travel restrictions and move to a new business model by clients meant we did not need to be present in their offices.

One major announcement is that Octane has signed up as a business partner Blackline. Blackline is a fast growing Financial Close and Finance Automation System. It fits in well with our current offering to the office of Finance and operations.

The other significant milestone was the launch of DataFusion. This is a connector developed in-house to connect  Planning Analytics TM1 to PowerBI, Tableau or Qlik seamlessly. These are some of the common reporting tools and typically require manual data uploads. This leads to reconciliation issues and untimeliness of reporting data. This has resonated very well with the TM1 community.

We also have a number of vendors who are discussing partnership opportunities with us and we will be making these announcements as they get finalised. This is largely a manifestation or realisation that in the current climate our business model of onshore/offshore hybrid model provides the best cost benefit equation for clients.

Octane Community

We at Octane have always been part of the community and have been hosting User Groups in all the cities we operate in. With the onset of Covid we have stressing our efforts in hosting a monthly User Group meetup. . Our meetups are generally focused on providing tips/tricks and “how to “ sessions for existing user base of Planning Analytics. The registration of the User groups have been increasing steadily.

As a part of our corporate social responsibility undertaking, we also try and support different community groups.. Octane sponsored a Drive in a Lamborghini in the NSW WRX clubs Annual North rally which raises funds for Cystic Fibrosis of NSW. One of friends who I used to race with, Liam Wild, succumbed to the disease in 2012.

This year my kids also started competing in the Motorkhana series with me and this has been great fun and a welcome distraction during the pandemic as we bonded (fought) during the long hours in the garage and practice runs.

Looking back, I would like to express my sincere gratitude for the trust and support Octane has received. With the pandemic here to stay at least until the end of this year, wishing for a blessed and successful 2021 for all.

Image 4
Race Days - trick to beating them is to give them a slower car
 
20200715_141930-2
Mud Bath - Social Distancing done right

20200801_130657-2

 
Clean and ready for next high Octane adventure


Line

Session Timeout for TM1Web, PAW and PAX

Mode_Comment_Icon_black0
Alarm_Icon_13 min

We might often get a request from users that TM1 session has logged. As per the client requirement and standards, need to increase or decrease the session timeout. Changing the session timeout is a trade-off, it should not be too big or too small. If it’s too big then many inactive sessions can lead to server performance issues. If it is too small, then the user experience might be affected. 

Each application of TM1 has its separate session timeout parameter. Jump into the respective section, depending upon your need.

TM1Web

1. Go to <Installation Folder>\IBM\cognos\tm1_64\webapps\tm1web\WEB-INF\configuration and Open tm1web_config.xml file.

Screen Shot 2020-08-02 at 8.14.04 am


2. Change the HttpSessionTimeout to desired value.

a. Please note timeout value to be mentioned in minutes


Screen Shot 2020-08-02 at 8.14.13 am


3. Save and close the tm1web_config.xml file.

4. Restart the IBM TM1 Application Server service.


PAX

  1. Go to http://localhost:9510/pmhub/pm/admin. Below screen appears.


Screen Shot 2020-08-02 at 8.16.50 am

2. Sign-in using your credential at top right corner.

3. Expand Configurations and go to PMHub Session.


Screen Shot 2020-08-02 at 8.17.47 am


4. Change MaxInactivity Timeout value. Default value is 3600 sec.


Screen Shot 2020-08-02 at 8.17.54 am


PAW

1. Go to <PAW Installation Folder>\paw\config and open paw.env and defaults.env file.


Screen Shot 2020-08-02 at 8.18.47 am

2. Copy “export SessionTimeout” parameter from defaults.env file and add it to paw.env file with desired value and save.


Screen Shot 2020-08-02 at 8.19.02 am


Try out our TM1 $99 training 
Join our TM1 training session from the comfort of your home

find out more


Line

Automation in TM1 using AutoHotkey

Mode_Comment_Icon_black0
Alarm_Icon_13 min

This blog explains a few TM1 tasks which can be automated using AutoHotKey. For those who don't already know, AutoHotKey is open-source scripting language used for automation.

1. Run TM1 Process history from TM1 Serverlog :

With the help of AutoHotKey, we can read each line of a text file by using loop function and content is stored automatically in an in-built variable of function. We can also read filenames inside a folder using same function and again filenames will be stored in an in-built variable. Therefore, by making use of this we can extract Tm1 process information from Tm1 Serverlog and display the extracted information in a GUI. Let’s go through the output of an AutoHotKey script which gives details of process run.1. 

  • Below is the Screenshot of output when script is executed. Here we need to give log folder and data folder a path.

    Picture1-23
  • After giving the details and clicking OK, list of processes in the data folder of Server is displayed in GUI.

    Picture2-8

    Picture3-5
  • Once list of processes are displayed, double-click on process to get process run history. In below screenshot we can see Status, Date, Time, Average Time of process, error message and username who has executed the process. Thereby showing TM1 process history in TM1 server log. 

    Picture4-4


2. Opening TM1Top after updating tm1top.ini file and killing a process thread

With the help of same loop function which we had used earlier, we can read tm1top.ini file and update it using fileappend function in AutoHotKey. Let’s again go through the output of an AutoHotKey script which will open Tm1top.

  • When script is executed, below screen comes up which will ask whether to update adminhost parameter of tm1top.ini file or not.

    Picture7-3
  • Clicking “Yes”, new screen comes up where new adminhost is required to be entered.

    Picture8-4
  • After entering value, new screen will ask whether to update servername parameter of tm1top.ini file or not.

    Picture7-3
  • Clicking “Yes”, new screen comes up where new servername is required to be entered.

    Picture8-4
  • After entering a value, Tm1Top is displayed. For verifying access, username and password is required

    Picture10-2
  • Once access is verified, just enter the thread id which needs to be cancelled or killed.

    Picture11-4


Line

PA+ PAW+ PAX (Version Conformance)

Mode_Comment_Icon_black0
Alarm_Icon_15 min


PA + PAW + PAX

IBM, with the intention of adding new features to Planning Analytics ( TM1) and to its Visualization and reporting tools Planning Analytics Workspace and Planning Analytics for Excel new release are happening at regular intervals.

New version for Planning Analytics Workspace, Planning Analytics for Excel comes out every 15-40 days, for Planning analytics new version comes out every 3-6 months.

In this blog, I will be discussing about the version combinations to be used between these tools to get better/optimum results in terms of utilization, performance, compatibility and bugs fixes.

Planning Analytics for Excel ‘+’ Planning Analytics Workspace:

There are many versions of Planning analytics for Excel (PAX) from 2.0.1 till 2.0.48 latest version released, similarly we have many versions of planning Analytics Workspace(PAW) starting from 2.0.0 to 2.0.47.

Planning Analytics for Excel though installed, can only be used if Planning Analytics Workspace(PAW) is installed and running. So, the question to be answered is - will all versions of PAX work with all versions of PAW ? – Answer is NO. Yes, you read it right – not all versions of PAX are supported by every version of PAW. We have some versions which are supported and some versions which are Optimal, these are covered below.

Supported Versions :

Planning analytics for Excel (PAX) version will be supported by three versions of Planning Analytics Workspace(PAW), matching version, previous version and next version.  

Here is an example, current PAX version is 2.0.45 and current PAW version being used is 2.0.45. PAX current version will be supported by PAW version 2.0.45 (matching), 2.0.44 ( previous version) and 2.0.46 (next “version”). I have considered two scenarios to explain this better.

Scenario (PAX upgrade):

Say, a decision has been taken to upgrade PAX version to latest version 2.0.48  from 2.0.45, with above explanation, new PAX will only be supported by PAW ( 2.0.47, 2.0.46, 2.0.48). As existing PAW (being used) is 2.0.45, new PAX is not supported. This upgrade activity PAX (2.048), must include PAW upgrade as well. Planning analytics Workspace (PAW )has to be upgraded from 2.0.45 to PAW (2.0.48, 2.0.48, 2.0.49).

Scenario (PAW upgrade):

Say, a decision has been taken to upgrade PAW version(2.0.45) to version 2.0.47 but PAX existing version is 2.0.45 being used by Users.

If the PAW is upgraded to 2.0.47, it will support PAX versions (2.0.47, 2.0.46, 2.0.48) only. If there is PAW upgrade then PAX must be upgraded to either 2.0.46/ 2.0.47/ 2.0.48 versions as part of PAW upgrade activity.

Best suited/ optimal version :

Planning analytics for Excel (PAX) version though supported by three versions( matching, previous, next) of PAW, optimal results are achieved with matching and next version of Planning Analytics Workspace(PAW). 

Here is an example, current PAX version is 2.0.45 and current PAW version being used is 2.0.45. PAX current version, though supported by PAW (2.0.45, 2.0.44 and 2.0.46), optimal are (current and next versions) in this case optimal version is 2.0.45 and 2.0.46.

table 1

Planning Analytics ‘+’ Planning Analytics for Excel:

To check which PAX versions suit Planning Analytics version, we should always consider the bundled PAX/PAW package version as reference to PA.

For example, 2.0.43 PAX version is bundled with 2.0.7 PA version, 2.0.36 PAX is packaged with PA 2.0.6 version.

Supported and Optimal Versions :

Planning Analytics for Microsoft Excel will support three different long cadence versions of Planning Analytics.

  • Planning Analytics version that was bundled with version of Planning Analytics for Microsoft Excel or the most recent Planning Analytics version that was previously bundled with version of Planning Analytics for Microsoft Excel.
  • The two previous Planning Analytics versions before the bundled version.

Here is an example, PAX version 2.0.43 is bundled with 2.0.7 PA.  PAX 2.0.43 will be supported by PA (2.0.7(bundled version), 2.0.6 (previous) and 2.0.5 (previous)). PAX 2.0.43 will not work well with older version, also note that PAA has been introduced in PA 2.0.5 version.

Below table might help with PAX and PA supported/optimal versions.

table


For more details click here.

Read some of my other blogs :

Predictive & Prescriptive-Analytics 

Business-intelligence vs Business-Analytics

What is IBM Planning Analytics Local

IBM TM1 10.2 vs IBM Planning Analytics

Little known TM1 Feature - Ad hoc Consolidations

IBM PA Workspace Installation & Benefits for Windows 2016

Octane Software Solutions Pty Ltd is an IBM Registered Business Partner specialising in Corporate Performance Management and Business Intelligence. We provide our clients advice on best practices and help scale up applications to optimise their return on investment. Our key services include Consulting, Delivery, Support and Training. Octane has its head office in Sydney, Australia as well as offices in Canberra, Bangalore, Gurgaon, Mumbai, and Hyderabad. 


Try out our TM1 $99 training 
Join our TM1 training session from the comfort of your home

find out more


Line

Comparison of Linux vs Windows for IBM Planning Analytics (TM1)

Mode_Comment_Icon_black0
Alarm_Icon_110 min

Linux vs windows


If you are thinking of moving to Planning Analytics, then this document can help you in selecting the best Operating System (OS) for your PA installation. Planning Analytics currently supports operating systems listed below: 

  • Windows 
  • Linux 

At Octane, we have the expertise of working on both Windows and Linux environments and number of clients asked which one is the best-fit for their organisation? 

Although its looks like a simple question but hard to answer, we would like to highlight some aids of both to help you to select the best-fit for your organization. 

WINDOWS 

Versions Supported for Planning Analytics: 

  • Windows Server 2008 
  • Windows Server 2012 
  • Windows Server 2016 

Advantages 

  • Graphical User Interface (GUI) 

Windows makes everything easier. Use a pre-install browser to download the software and drivers. Use the install wizard and file explorer to install the software. The Cognos Configuration tool defaults to a graphical interface that's easy to configure. 

  • Single Sign On (SSO) 

If your organisation uses Active Directory for user authenticationsince it’s a Microsoft product so it’s easy to connect and setup Single Sign On (SSO) within Windows OS. 

  • Easy to Support  

It’s easy to do the Admin and maintenance related tasks due to its graphical interface. 

  • Hard to avoid GUI interface completely 

Even if you think to get rid of Windows, as Planning Analytics is GUI based product so it’s difficult to avoid windows environment completely. It’s easy to install and configure Planning Analytics in windows environment. 

  • IBM Support 

Almost all IBM support VMs are running on Windows, so it’s easy for IBM support team to replicate the issue. when they are trying to replicate an issue you might have discovered, it's quick and easy to test. 

LINUX 

Versions Supported for Planning Analytics: 

  • Red Hat Enterprise Linux (RHEL) 8 
  • Red Hat Enterprise Linux (RHEL) Server 6.8, 7.x 

Advantages 

  • Cost effective Linux servers are cost effective i.e. available at low price than Windows. If your organisation is running a large distributed environment than it can add up some costs. 
  • Security  While all servers have susceptibilities that can be locked down, Linux is typically less susceptible and more secure than Windows. 
  • Scripting  If you like to automate processes such as startup/shutdowns and server maintenance, the Linux command line and scripting tools make this easy. 

 There are number of Linux OS versions available in the market and due to this it would be difficult to find the information for a specific version. 

CONCLUSION 

When it comes to selecting an operating system, there is no right or wrong choice. It’s totally depends on the usage and how much comfortable you are with the selected OS. At Octane we do prefer to suggest Windows OS because of its simple UI for install and config as well as the support base. However, if you run a Linux-based shop and have server administrators who are comfortable and prefer Linux, then go with Linux we are here to help you. 

Line

Planning Analytics Secure Gateway: Token Expiry

Mode_Comment_Icon_black0
Alarm_Icon_13 min

Before you read further, please note, this blog details secure Gateway connection used for Planning Analytics deployed “on-cloud” Software as a Service (SaaS) offering.

This blog details steps on how to renew secure gateway Token, either before or after the Token has expired.

What is IBM Secure Gateway:

IBM Secure Gateway for IBM Cloud service provides a quick, easy and secure solution for establishing link between Planning Analytics on cloud and a data source; Typically, an RDBMS source for example IBM DB2, Oracle database, SQL server, Teradata etc. Data source/s can reside either “on-premise” or “on-cloud”.

Secure and Persistent Connection:

By deploying this light-weight and natively installed Secure Gateway Client, a secure, persistent connection can be established between your environment and cloud. This allows your Planning Analytics modules to interact seamlessly and securely with on-premises data sources.


Picture1-22


How to Create IBM Secure Gateway:

Click on Create-Secure-Gateway and follow steps to create connection.

Secure Gateway Token Expiry:

If the Token has expired, Planning Analytics Models on cloud cannot connect to source systems.

How to Renew Token:

Follow below steps to renew secure gateway token.

  • Navigate to the Secure Gateway
  • Click on the Secure Gateway connection for which the token has expired.
  • Go to Details as shown below and enter number 365 (max limit) beside Expiration days. Here 365 or a year is the maximum time after which the token will expire again. Once done click update.

Picture2-7

This should reactivate your token, TIs should now interact with source system.


You may also like reading “ Predictive & Prescriptive-Analytics ” , “ Business-intelligence vs Business-Analytics ” ,“ What is IBM Planning Analytics Local ” , “IBM TM1 10.2 vs IBM Planning Analytics”, “Little known TM1 Feature - Ad hoc Consolidations”, “IBM PA Workspace Installation & Benefits for Windows 2016

Line

Adding customizations to Planning Analytics Workspace

Mode_Comment_Icon_black0
Alarm_Icon_14 min

IBM, in Planning Analytics Workspace’s 2.0.45 release however has addressed some limitations by extending the flexibility to users to upload the fonts and color themes of their choice in Workspace and apply it in their visualisations.

One of the common complaints that I constantly hear from users and have myself put up with when using Planning Analytics Workspace is its lack of available fonts and color pallets for its visualisations.

The lack of this flexibility put  a hard restriction on designing intuitive interfaces and dashboards as we’re limited by only a certain fonts or color combinations provided by the platform. This becomes even more challenging when we had to follow the corporate color scheme and font type but this is no more!

Users can now add new themes by exporting the json file from Administration page in PAW and uploading the file with updated code for new color themes back.

http://colorbrewer2.org/# website offers some sample color pallets to quickly get started with ready to use customised color codes that you can paste in the json file.

Similarly, you may choose any free color picker extension of your choice available in Chrome Web Store to get the hexa code from anywhere within a webpage. 

As for fonts, you can either download free Fonts from Google directly (https://www.fonts.com/web-fonts/google ) or you can go to https://www.fonts.com/web-fonts to purchase a desired font from its wide range of fancy fonts.

Tip: My all time favourite is Webdings font as that allows me to use the fonts as images so it enhances the performance of my dashboard by substituting the images with fonts displayed as icons/image thereby considerably reducing the dashboard refresh time and rendering of the data.

See the full list of graphics that it this font can display from the below link.   http://www.911fonts.com/font/download_WebdingsRegular_10963.htm

Because this is a paid font, it would be highly desired if IBM can incorporate it in its existing list of fonts in PAW, until then it can be downloaded from Microsoft from below link.

https://www.fonts.com/font/microsoft-corporation/webdings


Refer the below IBM link to get more info on how to add the fonts and color palettes to PAW.

https://www.ibm.com/support/knowledgecenter/SSD29G_2.0.0/com.ibm.swg.ba.cognos.tm1_prism_gs.2.0.0.doc/c_paw_corp_identity_overview.html


To identify where the color pallete code is within the json file, search for keyword “ColorPalette” in Notepad++ and it should list the results which consists of the root branch called ColorPalette and ids that has a unique number suffixed against ColorPalette (see screenshot below)


image-81


Note: It is not easy to correlate the color palette you see in PAW with its corresponding json code (id) and the only way you can do so is by manually converting the hex code of a color of all ids into a color and then visually inspecting it in PAW, so it’s a bit of a manual process and it becomes even more tedious process when you start to add more color palettes.

And given this complexity, below are some of the key points that you’ve to be vary of when working with palettes in PAW.

  1. The color palettes displayed in PAW under Visualisation details corresponds to the placement order of the code within “ColorPalette” section of the json theme file. So if you have ColorPalette3 code placed above ColorPalette2 code, the second palette you see in PAW correlates to ColorPalette3 code.
    image-81
  2. The heat mapping color, however, corresponds to the numeric value of the id within the json file and not the placement order which is quiet weird. So if we take the same scenario from above, the 2rdnd palette in PAW(which correlates to ColorPalette3) will still apply the heat mapping color of the ColorPalette2. Therefore, it is important to keep the numeric order consistent to easily correlate the code with the palette in PAW.

image-81

  1. Incase same id is being repeated twice with different color codes, the first one that appears in the json file takes precedence and second one is ignored.
Line

TM1 object extensions

Mode_Comment_Icon_black0
Alarm_Icon_113 min


This article talks about different extensions/files seen in Data directory and how they are co-related to front-end objects that we see in architect. Since, TM1 is an in-memory tool so all objects seen like cube, dimension, TI process etc seen in Architect are saved in data directory with a specific extension and in a specific way to differentiate them from the other objects.

By understanding these extensions/files, it comes easier in finding objects and deciding which objects are needed to be considered to backup or moving a specific set of changes. Consider the case of taking an entire data folder backup which might take up a large amount of space; instead of only a few objects had under gone changes.  It would be more efficient to take backup of these changes then the complete data directory.

Also, by understanding these extensions and knowing what information it holds, developers can efficiently decide the objects that needed to be moved and their impact on the system when these objects are moved. To have a better understanding, lets divide the objects seen in TM1 into 3 sections i.e., dimension, cube and TI process & also what files are created in data directory.


Dimension objects

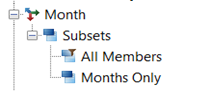
In this section, we will see what files are created in the data directory and what are they related in front-end interface of architect. To have a better understanding of how the dimension objects seen in architect are stored in data directory, we will take example of a dimensions called "Month" with 2 subsets "All Members" and "Months Only"

 image-55

*.dim File

The dimensions that are seen in Architect are saved in data folder with <DimensionName>.dim extension. The file holds the hierarchy and elements details of that dimension. If the dimension needs to be backup or migrated then we can just take this file. In this example, "Month" dimension seen in architect is saved in "Month.dim" file in the data directory and by reading this file, the architect shows the "Month" dimension and its elements with hierarchy.

In Architect

In Data Directory

image-56 image-57


*}Subs Folder

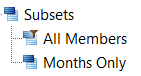
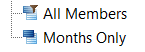
All the Public Subsets that are seen under the dimension in Architect are placed in <DimensionName>}Subs folder respective to that dimension in data folder. In this case, Subsets created for month dimension i.e., "All Members" and "Months Only" are placed in Month}subs Folder

In Architect

In Data Directory

image-58

image-59


*.Sub File

The Subsets are created to make it easier to access the set of elements of a dimension and all the subsets of a any dimension are placed in <DimensionName>}Subs folder with <SubsetName>.Sub extension. The Subsets of Month Dimension i.e., "All Members" and "Months Only" are saved in the "Month}subs" Folder as All Members.sub and Months Only.sub

In Architect

In Data Directory -> Month}subs

image-60

image-61


Cube Objects

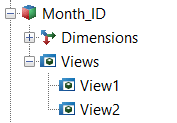
In this section, we will go through the files that are created in data directory for Cube related objects & how are they co-related to the cube objects in the architect. For this case, let’s use the cube "Month_ID" Cube as an example along with its Views "View1" & "View2".

image-62

*.Cub File

The cube and data seen in architect of any cube are saved in <CubeName>.cub file in data directory. So, if only the data needs to copied/moved from different environments, we can do this just by replacing this file for that respective cube. Here, Cube "Month_ID" and its data seen in architect are saved in a file Month_ID.cub in data directory of that TM1 server

In Architect

In Data Directory

image-63 image-64


*}Vues Folder

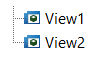
All the public views seen under the respective cube in architect are saved in <CubeName>}Vues Folder of the data directory. In this case, the views "View1" & "View2" of "Month_ID" Cube are saved in Month_ID}Vues Folder of data directory

In Architect

In Data Directory

image-65

image-65


*.vue file

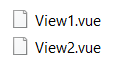
All the public views created under a cube are saved in <CubeName>}Vues Folder with a <ViewName>.vue extension. So, the views "View1" & "View2" are saved in Month_ID}Vues Folder as View1.vue and View2.vue


In Architect

In Data Directory->Month_ID}vues

image-67 image-68


*.RUX file

This is rule file, all rule statements written in Rule Editor for cube can be seen in <CubeName>.RUX file. Here, Rule statements written in rule editor for "Month_ID" cube are saved in Month_ID.rux file of TM1 data directory.

In Architect

In Data Directory

image-69

image-70


*.blb file

These files are referred as Blob files and they are used to hold the format data, for example if a format is applied inside Rule of a cube then that data is saved in <CubeName>.blb. Similar to this, if a format style is applied to a view then the format details are saved in <CubeName>.<ViewName>.blb file. In this Case, the format style data applied in rule editor for "Month_ID" cube is saved in Month_ID.blb and the Format style applied to the "View1" is saved in Month_ID.View1.blb file which can be found in TM1 Data Directory.

In Architect

In Data Directory

Format Style data Applied in Rules


image-71

Format Style applied in View1

image-72


*.feeders file

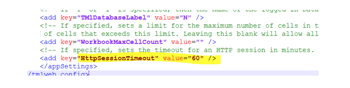
This file gets generated only when the Persistent Feeders is set "True" in TM1 Configuration file. Once the feeders have been computed in the system, they will be saved in <CubeName>.feeders and this file will be updated in the feeders. Here, Feeder statements present in Rule editor for "Month_ID" are calculated and are saved as Month_ID.feeders

In Architect

In Data Directory

Feeders statements in Rule for Month_ID Cube

image-73


TI and Chore Objects

Here, we are going to look at files that are created in data directory for TI processes and chores.

*.Pro file

All TI processes in the Architect are saved in data folder with <TIProcessName>.Pro extension. Now, assume that there is TI process "Month_Dimension_Update" seen in architect then this TI process is saved as Month_Dimension_Update.pro file in data directory.

In Architect

In Data Directory

image-74 image-75


*.Cho file

The chore which is used to schedule the TI process is saved in the data folder with <ChoreName>.cho extension. Say, we have to schedule the TI process "Month_Dimension_Update" so we create a chore, "Month_Dim_Update" and this will create a file Month_Dim_Update.cho

In Architect

In Data Directory

image-76 image-77


Application objects

Applications provide the functionality to create virtual folders and this helps in accessing and the orderly sorting of TM1 objects like dimensions, TI Process, Views, Excel reports and so on. When any TM1 Object is added in the Application folder/Virtual folder, it creates a shortcut for that object enabling us to access the object from the shortcut and we can also rename these shortcuts as required.

When these objects are added, in turn they create a file in }Applications Folder of datafiles. These files hold the object information like type, name, reference and so on. Let’s take example of test virtual folder below Application

image-78

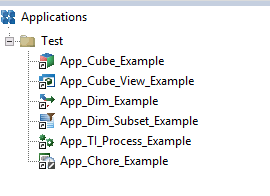
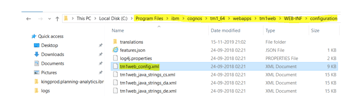
You can find these objects in datafiles Folder > }Applications Folder > Test Folder

image-79

image-80

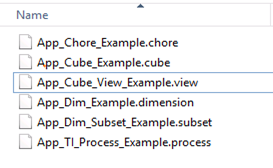
You can find table on how the objects are mapped from frontend architect to backend files in the data folder

Objects in TM1 Application

Object Type

Files create in Application Folder of Data Directory

Test

Virtual Folder

Test Folder

App_Cube_Example

Cube

App_Cube_Example.cube

App_Cube_View_Example

View

App_Cube_View_Example.view

App_Dim_Example

Dimension

App_Dim_Example.dimension

App_Dim_Subset_Example

Subset

App_Dim_Subset_Example.subset

App_TI_Process_Example

TI process

App_TI_Process_Example.process

App_Chore_Example

Chore

App_Chore_Example.chore

You can also add files, URLs and Excel files from the system to the TM1 Application Folder. When we add files like text file, excel file in TM1 Application folder, *.blob files are created in backend of }Applications Folder in data directory. Similarly, *.extr file is created for URL and this file is saved in the TM1 Application Folder.

Also, if we had selected “copy the file to the TM1 Server” then the copy of that file gets saved in the }External Folder of Data Directory . Similarly, When the report is created and upload from Perspective client of TM1 it creates *.blob File and places the file in the }External Folder.


Line

IBM Planning Analytics for Excel: Bug and its Fix

Mode_Comment_Icon_black0
Alarm_Icon_15 min

Since the launch of Planning Analytics few years back, IBM has been recommending its users to move to Planning Analytics for Excel (PAX) from TM1 Perspective and TM1 Web. As every day new users migrate to adopt PAX, it’s prudent that I share my experiences.

This blog will be part of a series where I would try to highlight and make users aware of different aspects of this migration. This one specifically details a bug I encountered during one of the projects in which our Clients was using PAX and steps taken to mitigate the issue.


What was the problem:

Scenario: when a Planning Analytics User triggers a process from Navigation Pane within PAX and uses “Edit parameters” option to enter value for a numeric parameter and clicks save to runs the process.

Issue:  when done this way, the process won’t complete and fail. However, instead if this was run using other tools like Architect, Perspective or TM1 Web, the process would complete successfully.

For example, let’s assume a process, cub.price.load.data takes a number value as input to load data. User clicks on Edit Parameter to enter value and saves it to run. The process fails. Refer screenshots attached.

Using PAX.

Picture1-18    Picture2-6

Picture3-4


Using Perspective

Picture4-3


What’s causing this:

During our analysis, it was found that while using PAX, when users click on Edit parameter,enter value against the numeric parameter and save it, in the backend the numeric parameter was getting converted into a String parameter thereby modifying the TI process.

As the TI was designed and developed to handle a numeric variable and not a string, a change in type of the variable from Numeric to String was causing the failure. Refer screenshots below.

 Picture5-3

When created,

Picture6-3

Once saved,

Picture7-2

What’s the fix?

Section below illustrates how we mitigated & remediated this bug.

For all TI’s using numeric parameter.

  • List down all TI’s using numeric type in Parameter.
  • Convert the “Type” of these parameters to String and rename the parameter to identify itself as string variable (best practice). In the earlier example, I called it pValue while holding numeric and psValue for String.
  • Next, within the TI in Prolog, add extra code to convert the value within this parameter back to same old numeric variable. Example, pValue =Numbr(psValue);
  • This should fix the issue.

Note that while there are many different ways to handle this issue, it best suited our purpose and the project. Especially considering the time and effort it would require to modify all effected processes.


Planning Analytics for Excel : Versions effected

Latest available version (as of 22ndOctober 2019) is 2.0.46 released on 13thSeptember 2019. Before publishing this blog, we spent good time in testing this bug on all available PAX versions. It exists in all Planning Analytics for Excel versions till 2.0.46.

Permanent fix by IBM:

This has been highlighted to IBM and explained the severity of this issue. We believe this will be fixed in next version of Planning Analytics for Excel release. As per IBM (refer image below), seems fix is part of the upcoming version 2.0.47.

Picture8-3 


You may also like reading “ Predictive & Prescriptive-Analytics ” , “ Business-intelligence vs Business-Analytics ” ,“ What is IBM Planning Analytics Local ” , “IBM TM1 10.2 vs IBM Planning Analytics”, “Little known TM1 Feature - Ad hoc Consolidations”, “IBM PA Workspace Installation & Benefits for Windows 2016”.

Line

IBM Planning Analytics Secure Gateway Client: Steps to Set-Up

Mode_Comment_Icon_black0
Alarm_Icon_17 min

This blog broaches all steps on how to install IBM Secure Gateway Client.

IBM Secure Gateway Client installation is one of the crucial steps towards setting up secure gateway connection between Planning Analytics Workspace (On-Cloud) and RDBMS (relational database) on-premise or on-cloud.

Picture1-22-1

What is IBM Secure Gateway :

IBM Secure Gateway for IBM Cloud service provides a quick, easy, and secure solution establishing a link between Planning Analytics on cloud and a data source. Data source can reside on an “on-premise” network or on “cloud”. Data sources like RDBMS, for example IBM DB2, Oracle database, SQL server, Teradata etc.

Secure and Persistent Connection :

A Secure Gateway, useful in importing data into TM1 and drill through capability, must be created using TurboIntegrator to access RDBMS data sources on-premise.

By deploying the light-weight and natively installed Secure Gateway Client, a secure, persistent and seamless connection can be established between your on-premises data environment and cloud.

The Process:

This is two-step process,

  1. Create Data source connection in Planning Analytics Workspace.
  2. Download and Install IBM Secure Gateway

To download IBM Secure Gateway Client.

  1. Login to Workspace ( On-Cloud)
  2. Navigate to Administrator -> Secure Gate

Picture2-5

Click on icon as shown below, this will prompt a pop up. One needs to select operating system and follow steps to install the client.
Picture3-3

Once you click, a new pop-up with come up where you are required to select the operating system where you want to install this client.

Picture4-2

Choose the appropriate option and click download.

If the download is defaulted to download folders you will find the software in Download folder like below.

Picture5-2

Installation IBM Secure Gateway Client:

To Install this tool, right click and run as administrator.

Picture6-2


Keep the default settings for Destination folder and Language, unless you need to modify.

Picture7-1

Check box below if you want this as Window Service.

Picture8-2

Now this is an important step, we are required to enter Gateway ids and security tokens to establish a secured connection. These needs to be copied over from Secure connection created earlier in Planning Analytics Workspace ( refer 1. Create Data source connection in workspace).

Picture9-2

Figure below illustrates Workspace, shared details on Gateway ID and Security Token, these needs to be copied and pasted in Secure Gateway Client (refer above illustration).

Picture10-1

If user chooses to launch the client with connection to multiple gateways, one needs to take care while providing the configuration values.

  1. The gateway ids need to be separated by spaces.
  2. The security tokens, acl files and log levels should to be delimited by --.
  3. If you don't want to provide any of these three values for a particular gateway, please use 'none'.
  4. If you want Client UI you may choose else select No.

Note: Please ensure that there are no residual white spaces.

Picture11-3

Now click Install, once this installation completes successfully, the IBM Secure Gateway Client is ready for use.

This Connection is now ready, Planning Analytics can now connect to data source residing on-premise or any other cloud infrastructure where IBM Secure Gateway client is installed.


You may also like reading “ Predictive & Prescriptive-Analytics ” , “ Business-intelligence vs Business-Analytics ” ,“ What is IBM Planning Analytics Local ” , “IBM TM1 10.2 vs IBM Planning Analytics”, “Little known TM1 Feature - Ad hoc Consolidations”, “IBM PA Workspace Installation & Benefits for Windows 2016”.

Got a question? Shoot!

Lorem ipsum dolor sit amet, consectetur adipiscing elit, sed do eiusmod tempor incididunt ut labore et dolore magna aliqua.

Get more articles like this delivered to your inbox