The Problem Every C-Suite Recognises but Few Have Solved
Your organisation is not short on information.
After a decade of digital transformation, most enterprises have built expansive repositories: policies, contracts, procedures, compliance frameworks, knowledge bases, operational runbooks, HR documentation, supplier records, regulatory filings. These assets represent years of institutional knowledge and millions of dollars of accumulated investment.
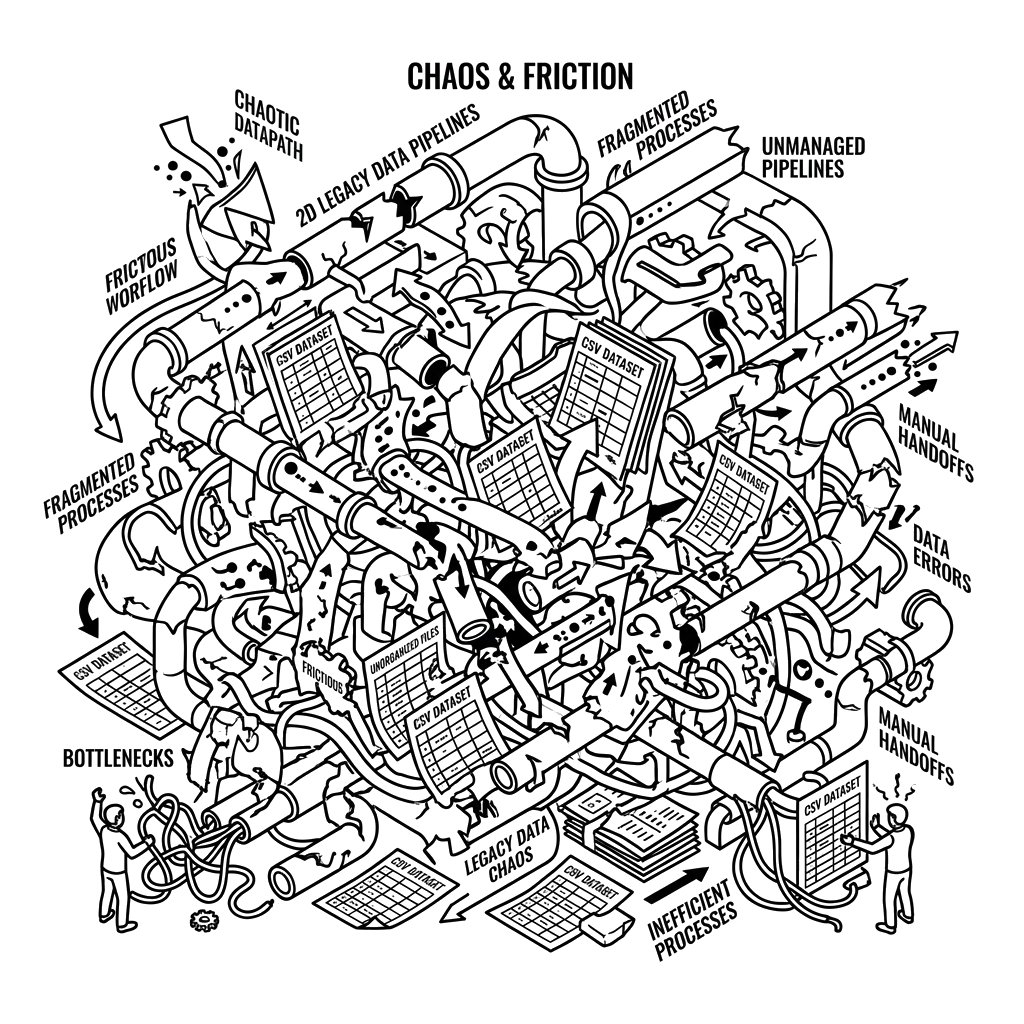
And yet, when an employee needs an answer, a real, accurate, contextual answer, they still open a search bar, scroll through folders, send an email, or wait for a reply.
The information exists. The problem is access, context, and trust.
McKinsey research estimates that knowledge workers spend an average of 1.8 hours every day searching for and gathering information. Across an enterprise of 10,000 employees, that is the equivalent of over 3,000 people doing nothing but searching, every single day.
This is not a content management failure. It is a knowledge operationalisation failure. And it is costing organisations far more than they realise.
The questions being asked every day inside your organisation reveal the gap plainly:
-
What policy applies to this situation?
-
Who approves this request, and at what threshold?
-
What compliance obligations apply to this transaction?
-
Which supplier holds the preferred contract?
-
What is the current version of this document?
-
Has this issue been resolved elsewhere in the business?
The answers exist, buried in documents that were designed to be stored, not used.
"Most enterprise knowledge is archived. Very little of it is operationalised. This is the gap that Agentic AI is uniquely built to close."
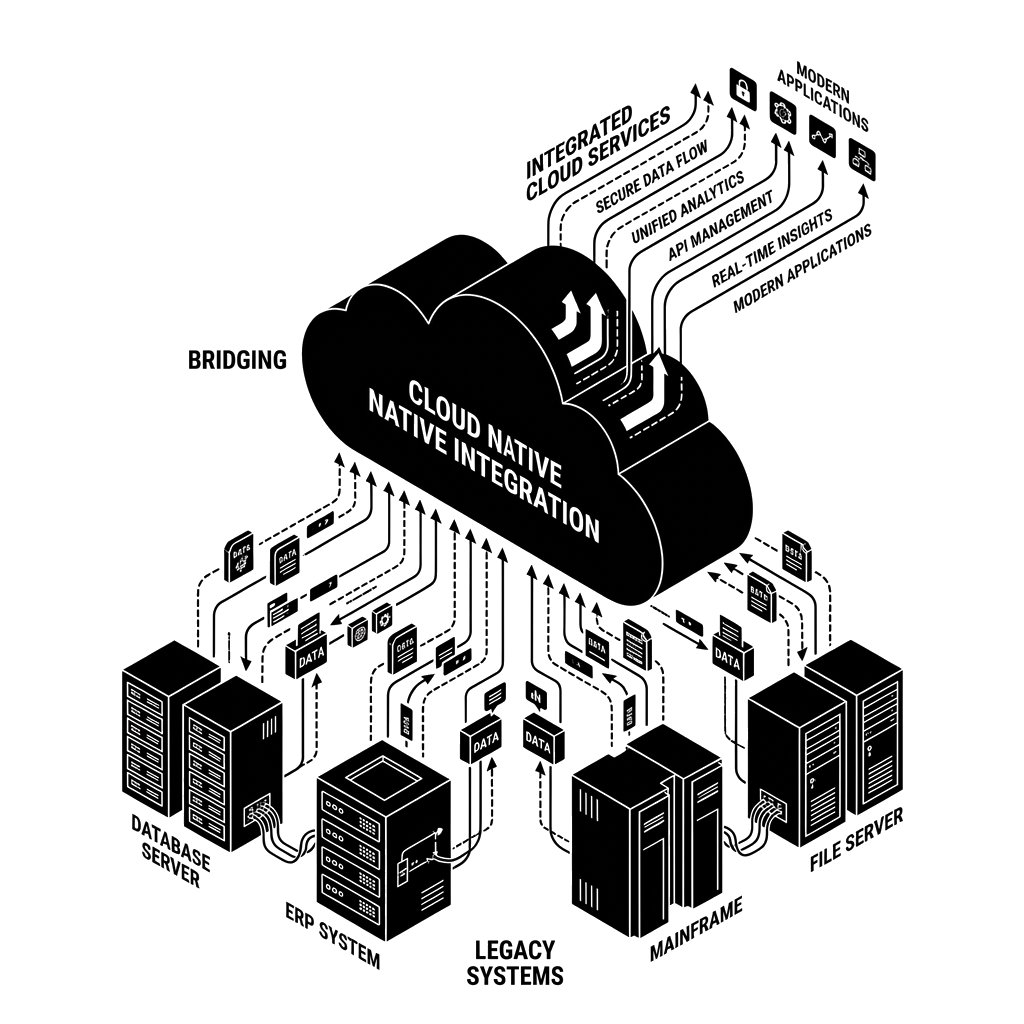
From Content Management to Knowledge Intelligence: A Strategic Shift
Traditional enterprise platforms were designed to store information. Agentic AI is designed to understand it.
This distinction matters enormously at the C-suite level. The shift is not incremental, it is architectural.
Instead of asking employees to navigate folder structures, keyword searches, and disconnected repositories, an intelligent AI agent allows them to ask a question in plain language and receive an accurate, contextual, source-cited answer in seconds. The experience moves from:
"Search and hope you find the right document."
to
"Ask and receive a trusted, actionable answer."
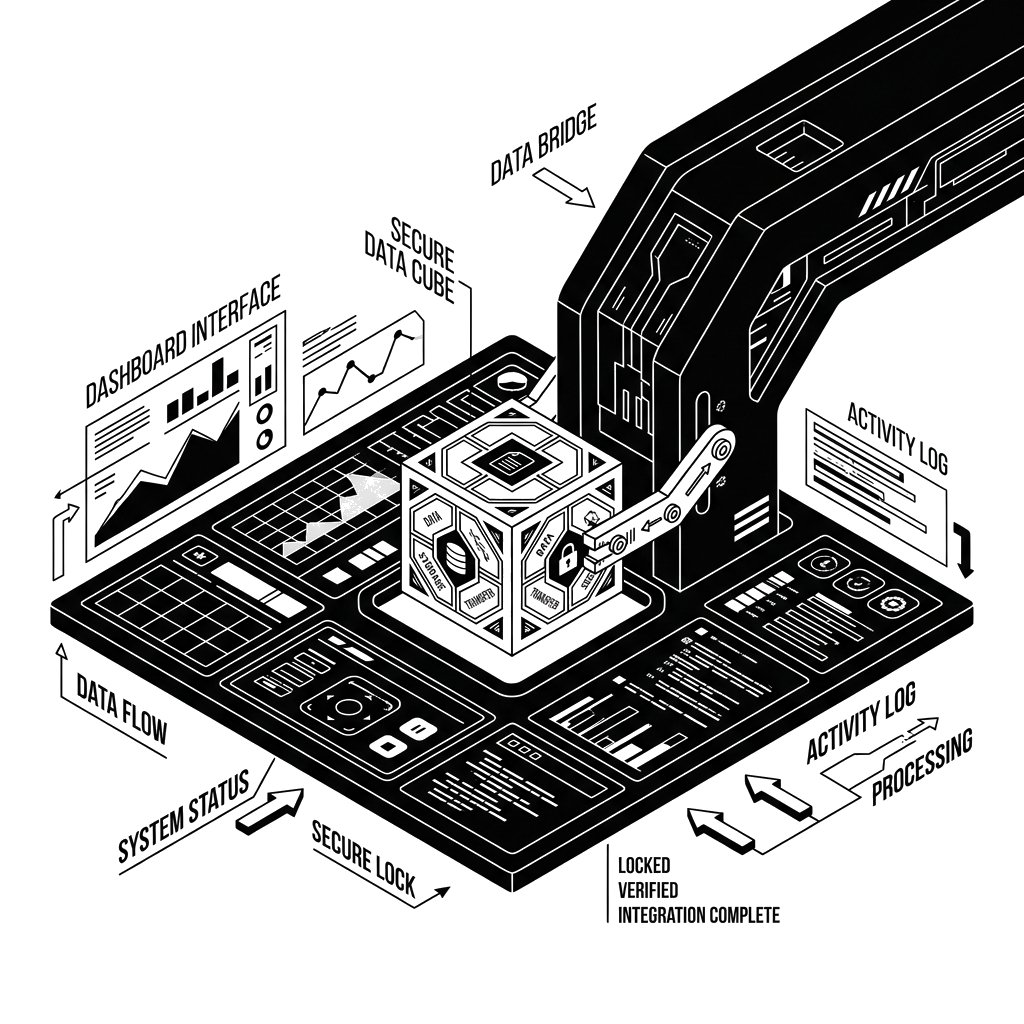
This is not another chat interface or search upgrade. It is a fundamental change in how enterprise knowledge becomes a business asset, one that informs decisions, reduces risk, accelerates operations, and scales without adding headcount.
At Octane, we have helped organisations make exactly this transition. We build intelligent AI agents that transform enterprise content into a conversational, governed, and actionable knowledge layer, one that answers questions, interprets policies, generates insights, and orchestrates business processes at scale.
What Separates Agentic AI from Everything That Came Before
Most organisations have experimented with Generative AI. Many have built chatbots, piloted copilots, or deployed search enhancements. Most of these initiatives delivered limited value and stalled at the proof-of-concept stage.
The reason is simple: they were designed to generate content, not to reason about it.
Agentic AI operates at a fundamentally different level. The shift from generative tools to enterprise-grade agents requires architectural foresight, business alignment, and strict governance, not just better models.
An enterprise AI agent does not simply retrieve a document. It:
-
Understands the intent behind a question
-
Searches across the enterprise knowledge corpus
-
Interprets policies, procedures, and obligations in context
-
Evaluates the user's role, location, and permissions
-
Applies relevant business rules and thresholds
-
Generates a clear, precise recommendation
-
Cites authoritative sources for every claim
-
Executes actions or triggers downstream workflows
-
Escalates to human reviewers when confidence is insufficient
-
Learns and improves from each interaction
The result is not another search tool. It is a trusted digital colleague, one available to every employee, across every department, at every hour.
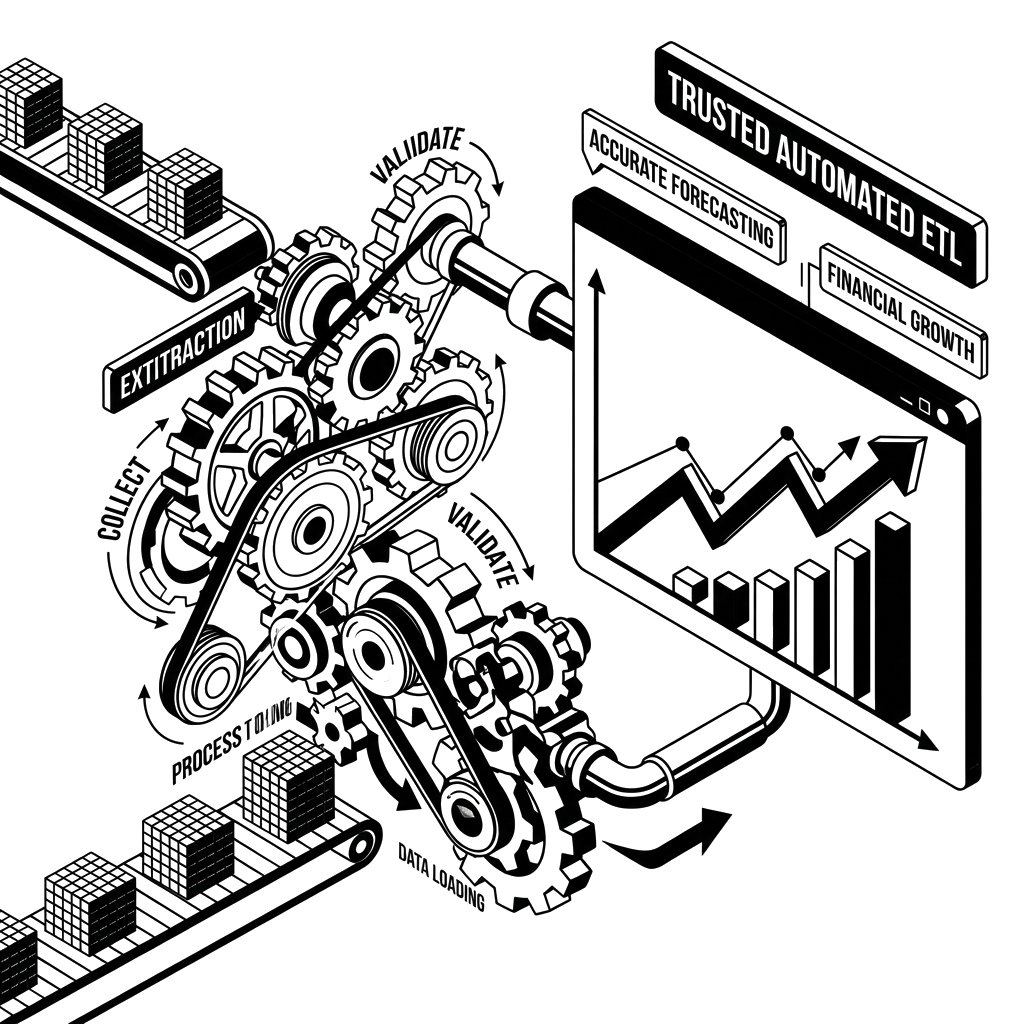
The Architecture Behind Enterprise-Grade Accuracy
Here is where strategy meets engineering, and where most AI initiatives fail.
Building a basic AI assistant is straightforward. Building one that consistently delivers accurate, auditable, and reliable answers at production scale is substantially harder.
Any technical research will show that, the gap between a working prototype and a trusted enterprise platform spans multiple engineering disciplines: document preparation, intelligent chunking, hybrid retrieval strategies, domain alignment, continuous evaluation, and governance controls.
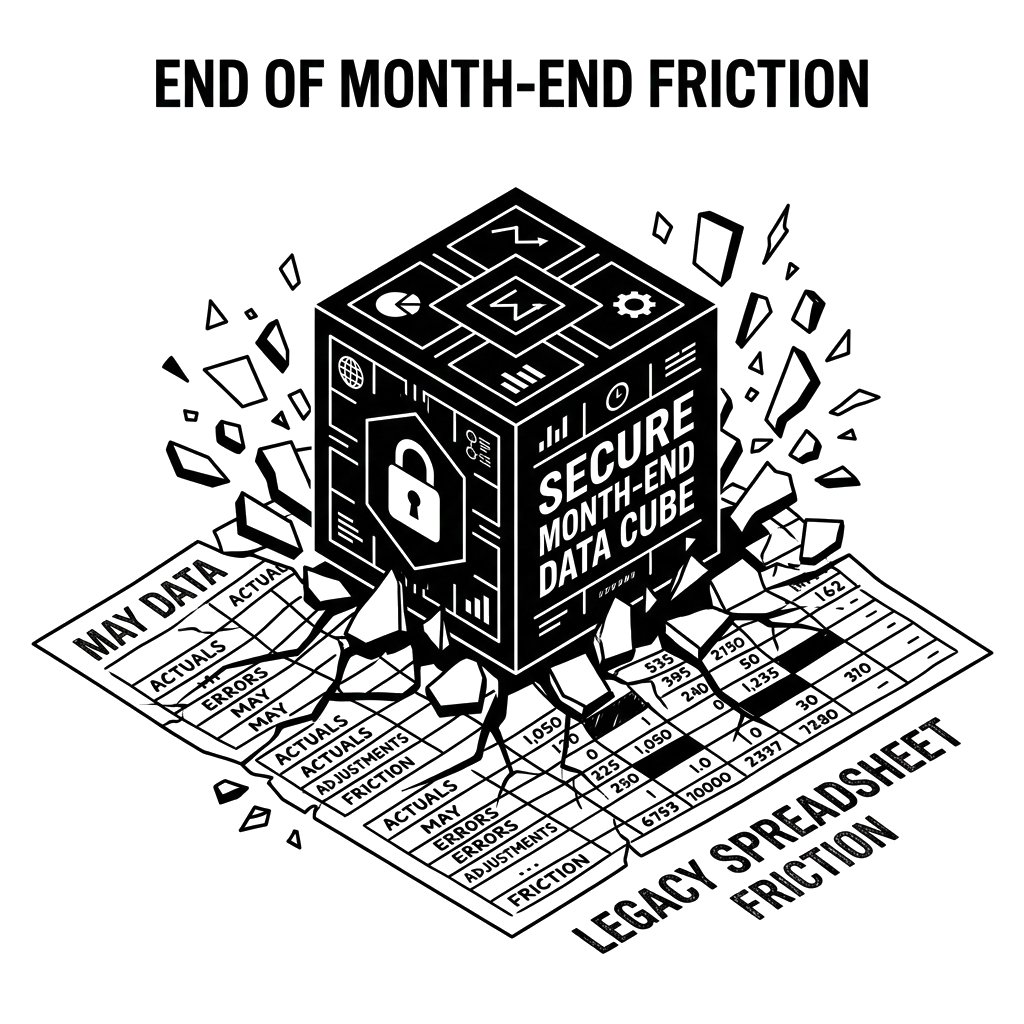
Most enterprise knowledge was never created with machine readability in mind. PDFs contain tables that break during extraction. Scanned documents carry OCR errors. Policies are written in deliberately broad language. PowerPoint decks rely on visual flow rather than explanatory text. Multiple conflicting versions of the same document often coexist.
A simple AI pipeline ingests all of this without discrimination. A production-grade Agentic AI system cannot afford to.
The difference between a 60% accuracy system and a 95% accuracy system, the threshold at which enterprise trust is established, lies in five areas:
Data Preparation: Normalised formatting, semantic chunking, rich metadata tagging (ownership, jurisdiction, effective date), and active deduplication of conflicting content.
Intelligent Retrieval: Hybrid search combining vector similarity with keyword matching. Dynamic chunk sizing. Re-ranking models calibrated to your domain. Query rewriting and expansion. Retrieval defines the boundaries of truth; improving it delivers larger gains than upgrading the model itself.
Domain Alignment: General-purpose language models are fluent but not domain experts. High-accuracy enterprise systems include domain-tuned models, precisely engineered system prompts, and explicit constraints that ground answers in verified organisational sources.
Continuous Evaluation: Accuracy is not achieved once. It requires ongoing measurement against real user queries, expert-validated ground truth, multi-dimensional response grading, and regression testing after every content or configuration change.
Governance by Design: In enterprise and regulated environments, accuracy alone is insufficient. Every response must be explainable, traceable, auditable, and governed. This is the bar that separates pilots from platforms.
The Octane Delivery Model: Powered by IBM watsonx
Octane delivers Agentic AI solutions built on IBM's enterprise-grade AI platform, watsonx Orchestrate, giving your organisation access to one of the most capable and governed AI ecosystems available today.
At the centre of this ecosystem is IBM's Agent Catalogue: a central hub that makes it easy to discover, deploy, and orchestrate specialised AI agents built by IBM and its global partner network. These agents are framework-agnostic, meaning they can be built with any modern development stack and integrate seamlessly with the watsonx Orchestrate environment.
Through IBM Agent Connect, Octane's specialised agents integrate directly into your watsonx environment, delivering pre-built capabilities focused on specific business domains, with the productivity enhancements and process simplifications your teams need from day one.
This architecture means your Agentic AI investment is not a bespoke, isolated prototype. It is built on an open, scalable platform backed by IBM's global enterprise infrastructure, security frameworks, and partner ecosystem, reducing time to value while maximising long-term extensibility.
Where Agentic AI Delivers Measurable Business Impact
Agentic AI is not a horisontal technology looking for a problem. It is a targeted capability that delivers measurable outcomes in specific, high-value enterprise domains.
Human Resources & Employee Experience
Employees spend significant time searching for HR information or waiting days for responses to routine questions. An intelligent HR agent answers instantly and consistently:
"What parental leave am I entitled to in my region?" "Can I carry over unused annual leave this year?" "What is the reimbursement limit for international travel?"
The agent interprets policies, applies regional requirements, and delivers cited responses, reducing HR support workload, accelerating onboarding, and improving employee experience at scale.
Governance, Risk & Compliance
Compliance creates value only when employees understand and follow it, a condition that is remarkably difficult to sustain across large organisations.
"Can I share this customer record with a third-party vendor?" "What approvals are required before signing this agreement?" "Which privacy obligations apply to this process?"
The agent reviews applicable policies, interprets requirements in context, and provides evidence-backed guidance, reducing violations, accelerating decisions, and creating a defensible audit trail.
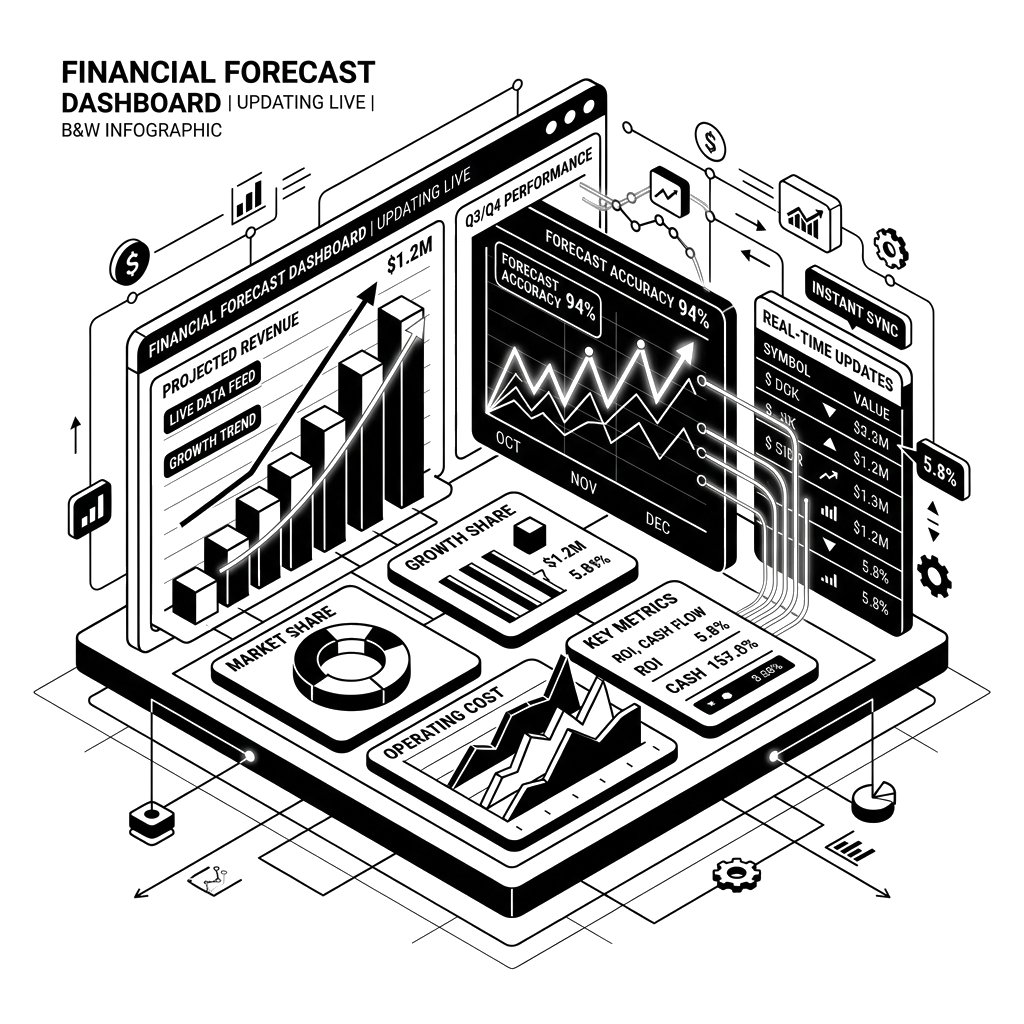
Finance Operations
Finance teams operate across thousands of transactions, controls, and approval frameworks. Manual policy lookup is a bottleneck that compounds across every department.
"What approval is required for capital expenditure over $50,000?" "Which expense category should this purchase be assigned to?" "What is our current policy on FX hedging for subsidiary transactions?"
Immediate, accurate answers reduce approval delays, improve policy compliance, and strengthen financial governance.
Procurement & Vendor Intelligence
Procurement teams manage complex supplier ecosystems across contracts, SLAs, ESG obligations, and preferred vendor registers.
"Who is our preferred cloud infrastructure vendor in APAC?" "What service levels apply to this support contract?" "Which of our current suppliers are certified against our ESG requirements?"
The agent retrieves answers directly from contracts, supplier records, and procurement policies, accelerating cycles and improving compliance.
Customer Service & Contact Centre
Service agents lose significant time searching internal systems for product information, escalation paths, and policy guidance. Agentic AI delivers that knowledge in real time, reducing handling times, improving first-contact resolution, and lowering operational costs without increasing headcount.
Healthcare & Clinical Operations
Healthcare professionals require immediate access to clinical protocols, pre-operative requirements, and compliance obligations. Agentic AI delivers approved guidance instantly, improving patient safety and reducing administrative burden.
The Business Case: A Quantified Return
Organisations implementing enterprise Agentic AI knowledge platforms consistently achieve:
|
Business Outcome
|
Typical Impact
|
|
Employee search time reduction
|
4.5+ hours saved per employee per week
|
|
Support ticket deflection
|
20–40%
|
|
Support team productivity
|
14–15% improvement
|
|
Issue resolution speed
|
30–50% faster
|
|
Overall employee productivity
|
5%+ improvement
|
|
Policy compliance consistency
|
Measurable governance uplift
|
|
Decision speed
|
Significant reduction in knowledge latency
|
For a mid-size enterprise of 5,000 employees, 4.5 hours saved per employee per week represents approximately 22,500 hours of recovered productive capacity, every week.
The question is not whether the ROI justifies the investment. The question is how quickly you can move from assessment to deployment.
The Octane Approach: From Strategy to Scale
Most AI consulting firms help you define a strategy. Octane helps you execute one.
We have won multiple global awards for transforming businesses through Agentic AI, not through theoretical frameworks, but through delivered systems that operate in production environments across regulated industries including Financial Services, Healthcare, Government, Telecommunications, and Critical Infrastructure.
Our engagement model is structured to move organisations from curiosity to capability at pace.
AI Strategy & Opportunity Assessment
We identify where Agentic AI creates the highest measurable value in your specific organisation, grounded in your data, your processes, and your competitive position. Not generic use cases. Your use cases.
Agent Design & Architecture
We design agents that are grounded in your business processes, governance requirements, and operational realities. Every agent is built with explainability, auditability, and scalability as first-class requirements, not afterthoughts.
Enterprise Integration
We connect agents to your existing business systems: ERP, CRM, HRIS, document management, workflow platforms, and operational data sources. Agents that cannot operate within enterprise systems cannot scale.
Enablement & Knowledge Transfer
We do not gatekeep. Our enablement programs are designed to transfer knowledge, skills, and confidence to your team, so that your organisation does not just use AI, but owns it. From technical deep dives to executive briefings, every session is tailored to your team's goals and capability level.
Governance, Security & Trust
Every solution Octane delivers is secure, auditable, explainable, and enterprise-ready. We build governance by design, not compliance as an afterthought. This is non-negotiable in regulated environments and increasingly expected in every sector.
Scale & Optimisation
We expand from a proven first use case into an enterprise-wide Agentic AI operating model, one that evolves as your business evolves.
What Your Organisation Could Build
Whether the priority is a single high-impact agent or an enterprise-wide knowledge platform, Octane has the capability, methodology, and platform partnerships to deliver it:
-
Ask HR, Employee policy and entitlement advisor
-
Ask Finance, Approvals, expense, and financial policy assistant
-
Corporate Policy Advisor, Governance and compliance intelligence layer
-
Procurement Assistant, Supplier, contract, and vendor intelligence
-
Compliance Advisor, Regulatory obligation and risk guidance
-
Legal Knowledge Agent, Contract interpretation and escalation
-
Service Desk Assistant, Internal IT and operations support
-
Enterprise Ask-Me-Anything Platform, Unified knowledge access across the organisation
The goal across every one of these is the same:
Transform information into action. Transform content into decisions. Transform knowledge into competitive advantage.
Three Ways to Engage Octane
We meet organisations wherever they are in their Agentic AI journey.
Discovery Workshop: A structured half-day or full-day session to map your highest-value AI opportunities, assess your knowledge estate, and define a prioritised roadmap. Designed for leadership teams ready to move from awareness to action.
Enterprise Readiness Assessment: A comprehensive evaluation of your data, governance, technology, and organisational readiness for Agentic AI at scale. Delivers a detailed implementation blueprint with defined business cases and ROI projections.
Agentic AI Implementation: End-to-end delivery of your first production-grade AI agent, from design and integration through deployment, evaluation, and enablement. Built on IBM watsonx Orchestrate. Designed to scale.
The Organisations That Move First Will Move Furthest
The competitive dynamics of Agentic AI are not symmetrical.
Organisations that deploy trusted, production-grade knowledge agents over the next 12 to 18 months will accrue structural advantages: faster decision-making, lower operational costs, stronger governance, and institutional knowledge of what works at scale in their industry.
Organisations that wait will face a widening gap, not just in technology, but in organisational capability and institutional confidence.
The question is no longer whether your organisation has the information it needs.
The question is whether your people can access it, trust it, and act on it, at the speed your business demands.
Octane builds the bridge.
Ready to Begin?
Discover how Octane can transform your enterprise knowledge, policies, procedures, and operational content into a governed, intelligent, AI-powered platform that delivers measurable value across the entire organisation.
Book a Discovery Workshop → Request an Enterprise Readiness Assessment → AI Implementation Roadmap by an Agentic AI Specialist
Octane is an award-winning Agentic AI consulting firm specialising in strategy, agent design, enterprise integration, and organisational enablement. Our solutions are built on IBM watsonx Orchestrate, one of the world's most capable and governed enterprise AI platforms.


.png)


.png?width=604&height=340&name=roadmap%20(1).png)


.png)


.png)

.png)
.png?width=595&height=341&name=From%20Insight%20to%20Impact%20(1).png)
.png?width=530&height=304&name=Alan%20blog%20(1).png)


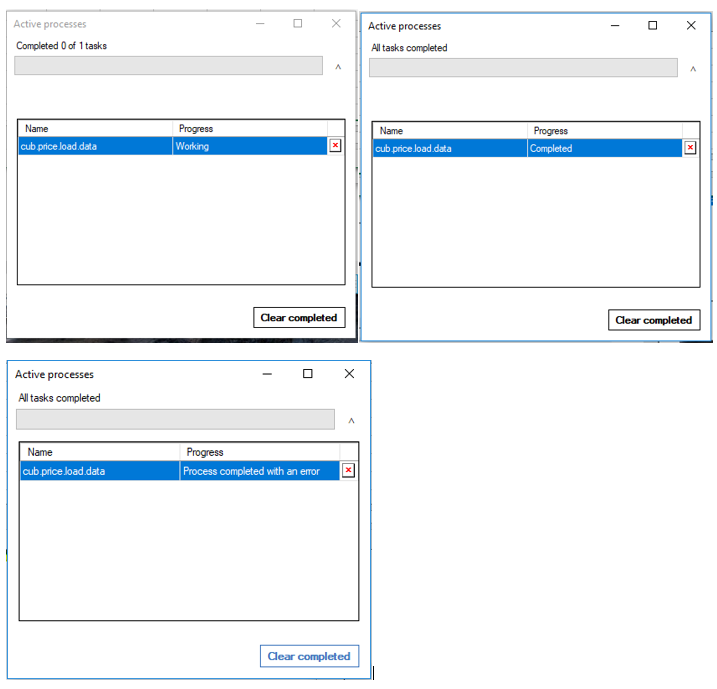
 Indicates that the PA application is in a critical state and may potentially


.png?width=488&height=281&name=Future%20of%20finance%20(1).png)

-1.png?width=457&height=90&name=image%20(2)-1.png)

.png?width=435&height=249&name=TM1%20newsletter%20(8).png)


.png?width=573&height=328&name=blog%20(1).png)
.gif?width=600&height=243&name=ezgif.com-video-to-gif%20(3).gif)
.webp)


Leave a comment