Content_Cut_Icon Twitter_Brands_Icon

Mastering MDX in IBM Planning Analytics Workspace

Mode_Comment_Icon_white0
Alarm_Icon_1_white9 min

Part 1: Essential Functions Every TM1 Developer Should Kno MultiDimensional Expressions (MDX) is one of the most powerful features available in IBM Planning Analytics Workspace (PAW). While many TM1 developers rely on static subsets, mastering MDX opens the door to dynamic reports, intelligent dashboards, and significantly reduced maintenance In this first article of the series, we'll explore ...

down-arrow-blue
Book_Open_Solid_Icon

Part 1: Essential Functions Every TM1 Developer Should Kno

MultiDimensional Expressions (MDX) is one of the most powerful features available in IBM Planning Analytics Workspace (PAW). While many TM1 developers rely on static subsets, mastering MDX opens the door to dynamic reports, intelligent dashboards, and significantly reduced maintenance

In this first article of the series, we'll explore three fundamental MDX functions that every TM1 developer should understand:

  • TopCount()

  • Filter()

  • Descendants()

These functions form the building blocks of many real-world PAW applications.

Why Learn MDX?

Static subsets require manual maintenance and often become outdated. MDX allows subsets to adapt automatically to changing data and hierarchies.

With MDX, you can:

  • Create dynamic reports.

  • Build interactive dashboards.

  • Automatically rank and filter data.

  • Simplify maintenance.

  • Deliver more flexible analytics to business users.

Let's look at three commonly used functions.

1. TopCount() – Find Your Top Performers

The TopCount() function returns the top members from a set based on a specified measure.

Syntax

Example: Top 10 Products by Revenue


What This Does

  • Evaluates all products.

  • Sorts them based on Revenue.

  • Returns the top ten products.

Typical Use Cases

  • Top 10 customers by sales.

  • Highest-cost departments.

  • Top-performing regions.

  • Best-selling products.

Dashboard Example

A PAW dashboard displaying:

Top 10 Products by Revenue
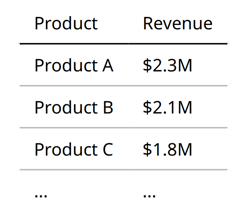
Since the subset is dynamic, rankings update automatically whenever the data changes.

2. Filter() – Show Only What Matters

The Filter() function allows you to return members that satisfy a specific condition.

Syntax

Example: Customers with Revenue Above $1 Million

 

What This Does

  • Evaluates every customer.

  • Keeps only customers whose revenue exceeds $1 million.

  • Excludes all others

Common Business Applications

Budget Variance Reporting

Show only cost centers exceeding budget:

 

Active Employees

Display only employees with a headcount value greater than zero:

 

Product Profitability

Show products with positive margins:

 

Why Use Filter?

Instead of maintaining manual subsets every month, your reports automatically update based on business rules.

3. Descendants() – Navigate Hierarchies Dynamically

TM1 dimensions are hierarchical by nature. The Descendants() function retrieves all child members below a specified parent.

Syntax

Example

Suppose the Region hierarchy looks like this:

Using:

 

returns:

Common Use Cases

Regional Reporting

Display all locations under North America.

Cost Centre Rollups

Retrieve all departments under Finance.

Organizational Structures

Expand reporting relationships automatically.

Product Hierarchies

Display all SKUs belonging to a product family.

Benefits

When new members are added to the hierarchy, they are automatically included without requiring changes to the subset.

Combining Functions

MDX functions become especially powerful when combined.

Example: Top 10 Profitable Products
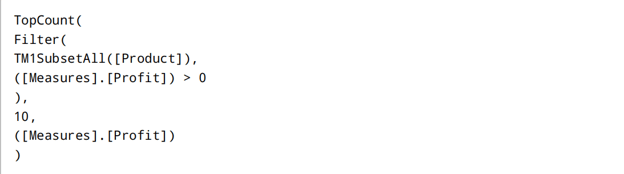
What Happens?

Step 1:

Filter removes products with negative profit.

Step 2:

TopCount selects the ten most profitable products.

This type of expression is commonly used in executive dashboards.

Performance Considerations

Prefer Dynamic subsets

Dynamic subsets reduce manual maintenance and improve flexibility.

Use Filter Carefully

Filtering very large dimensions can impact performance. Consider limiting the initial set whenever possible.

TopCount Is More Efficient Than Order + Head

Instead of:
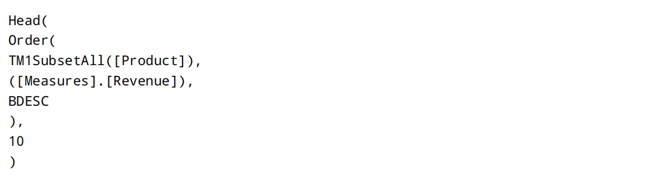
 

Use:

TopCount is cleaner and generally performs better.

Test Expressions in the PAW Set Editor

The Set Editor provides a quick way to validate and troubleshoot MDX expressions before deploying them into books and dashboards.

Conclusion

MDX is one of the most valuable skills a TM1 developer can master. Functions such as TopCount(), Filter(), and Descendants() enable dynamic reporting and significantly reduce the effort required to maintain subsets and dashboards.

By incorporating these functions into your Planning Analytics applications, you can deliver smarter, more responsive solutions to your users.

In Part 2, we'll explore time intelligence functions, including:

ParallelPeriod()

PeriodsToDate()

YTD calculations

Rolling periods

Year-over-Year analysis

These functions are essential for financial reporting and variance analysis.

Are you using MDX extensively in your Planning Analytics applications? Which function do you find most useful? Share your thoughts in the comments.

Leave a comment

Line

The CFO's Approach to Agentic AI in Finance

Mode_Comment_Icon_black0
Alarm_Icon_19 min

From experimentation to enterprise value — how finance leaders can adopt autonomous AI without losing control.

 For the last two years, most finance teams have used AI to draft, summarise, and answer. Agentic AI changes the question entirely. Instead of asking "What can AI tell me?", the CFO now has to ask "What should AI be allowed to do?"

That single shift — from AI as an assistant to AI as an actor — is the most consequential change to land on the finance function in a decade. And it lands squarely on the CFO's desk, because the CFO owns both sides of the equation: the upside of speed and capacity, and the guardrails of control, accuracy, and audit.


Here is a practical way to think about getting in.

What "agentic" actually means for finance

Generative AI produces content. You ask, it responds, you decide what to do next. Agentic AI is different: an agent can take a goal, break it into steps, pull data from your systems, take actions, and complete a multi-step workflow with limited supervision.

In finance terms, that is the difference between an AI that drafts a variance commentary when you ask, and an agent that notices the variance during close, gathers the supporting detail, drafts the explanation, routes it for review, and flags the two items that need a human decision.

The technology is genuinely capable now. The risk is that finance leaders either dismiss it as hype or rush in without the controls the function demands. The right path sits between those two.

The mindset shift the CFO has to make

For years, finance evaluated automation through a cost-and-efficiency lens: how many hours can we save? Agentic AI deserves a wider frame. The real prize is capacity and capability — releasing skilled people from low-judgment work so they can spend time on analysis, scenario planning, and partnering with the business.

But capability comes with a new responsibility. When an agent acts inside your ERP, your planning system, or your procurement workflow, it inherits the same scrutiny any process would face: Is it controlled? Is it auditable? Can we explain what it did and why? The CFO is no longer just the sponsor of an AI project. They are the architect of trust around it.

A practical approach: how to get in without getting burned

The CFOs who are succeeding aren't the ones who moved fastest. They are the ones who moved deliberately. A workable sequence looks like this:

1. Start with the value, not the technology. Pick processes that are high-volume, rules-bound, and high-friction — month-end close tasks, intercompany reconciliations, invoice matching, procure-to-pay routing, first-draft FP&A commentary. These give agents room to deliver measurable wins and a clear baseline to measure against.

2. Get the data house in order first. An agent is only as good as the data it reads and the system of record it writes to. Fragmented spreadsheets and undocumented logic don't become trustworthy just because an AI now reads them. A clean, governed financial data layer is the precondition, not an afterthought.

3. Design governance from day one. Decide upfront where a human must stay in the loop, what an agent is allowed to action autonomously, and what always requires sign-off. Build in audit trails, segregation of duties, and explainability before the first agent goes live — not after the first surprise.

4. Pilot narrow, measure hard. Run a contained pilot with explicit metrics: cycle time, error rate, exceptions handled, hours released. Resist the temptation to declare victory on anecdote. The numbers are what move agentic AI from an experiment to a board-level capability.

5. Build the operating model. Someone has to own the agents — monitor their performance, review their decisions, retrain them, and retire them when they drift. Treat them as part of the team's operating model, with clear ownership, not as a one-off tool that runs unattended.

6. Scale with controls, not without them. Once a use case is proven and governed, extend it. Each new agent should inherit the same controls, the same monitoring, and the same accountability as the first.

Where the early wins are

If you are looking for the first places agentic AI earns its keep in finance, the most reliable candidates are:

  • Record-to-report: reconciliations, journal preparation, close-task orchestration, and first-draft commentary.

  • FP&A: variance detection and explanation, data gathering for forecasts, and surfacing the anomalies that deserve a human's attention.

  • Procure-to-pay: purchase-requisition-to-purchase-order routing, vendor query handling, and invoice matching.

  • Order-to-cash: collections follow-ups, dispute triage, and cash application.

  • Compliance and controls: continuous monitoring, exception flagging, and audit-evidence assembly.

These are deliberately unglamorous. That is the point. Proving value on well-bounded, high-volume work builds the credibility — and the control patterns — you need before you let agents anywhere near judgment-heavy territory.

The risks the CFO must own

A balanced approach means naming the risks plainly:

  • Accuracy and hallucination. An agent that confidently produces a wrong number is worse than no agent. Validation and human review on material outputs are non-negotiable.

  • Control failures. Autonomy without segregation of duties is a control gap waiting to be found by an auditor.

  • Over-automation. Not every process should be handed over. Some decisions exist precisely because they require human judgment.

  • Data privacy and security. Agents touch sensitive financial data. Where it goes, who can see it, and how it is retained all need answers.

  • Change management. The technology is rarely the hard part. Helping experienced finance professionals trust, supervise, and work alongside agents is where most programmes succeed or stall.


The CFO as the architect of trust

Agentic AI will reshape how finance work gets done — that much is no longer in question. What is still being decided, in every organisation, is whether it gets done well. That outcome depends less on the model and more on the leadership around it.

The CFOs who get this right won't be the loudest adopters. They will be the ones who treated agentic AI the way they treat everything else in finance: with ambition for the value, and discipline about the control. Start with a real problem, govern it properly, measure it honestly, and scale what works.

Agentic AI doesn't reduce the CFO's role. It elevates it — from steward of the numbers to architect of the trusted, intelligent finance function that the rest of the business is about to depend on.

Octane Software Solutions partners with finance leaders to design and deliver governed, value-led AI and EPM transformations. If you're shaping your own approach to agentic AI in finance, we'd be glad to compare notes.


Line

IBM Planning Analytics Migration: The Power BI & Datafusion Blueprint

Mode_Comment_Icon_black0
Alarm_Icon_14 min

You have made the decision to migrate to IBM Planning Analytics (TM1) in the Cloud. You have mapped the architecture, and you are ready to leave your legacy spreadsheet grids behind. But for both IT and the CFO, the most critical bottleneck in a 2026 migration isn't getting the data into the cloud—it's getting it back out.

How do you connect a multi-dimensional TM1 cube directly to a modern visualization tool like Microsoft Power BI, without breaking the reporting layer or relying on brittle, overnight batch scripts?

Here is how the fastest-moving FP&A teams are solving the reporting bottleneck using Octane's proprietary Datafusion Connector.

The Legacy CSV Trap

Legacy CSV Pipelines

Historically, connecting TM1 to an external BI tool was a manual, high-friction process. IT teams were forced to write complex TurboIntegrator (TI) processes to export cube data into flat CSV files overnight.

For the CFO, this meant arriving in the morning to review dashboards built on yesterday's data. If a massive adjustment was made during the month-end close, the dashboard wouldn't reflect it until the next batch run. If the script failed, the entire reporting layer broke.

This reliance on manual exports and "middleware databases" completely defeats the purpose of moving to a high-speed, in-memory OLAP engine.

The Architectural Risk: Every time you export data into a flat CSV, you lose the multi-dimensional logic built into the TM1 cube. You are essentially flattening a 3D model into a 2D sheet, degrading the data's utility.

The Missing Link: The Datafusion Connector

Datafusion Connector

Octane Software Solutions recognized this exact friction point and engineered a proprietary solution: The Datafusion Connector.

Rather than relying on flat-file exports, Datafusion leverages the IBM Planning Analytics REST API. It acts as a seamless, high-speed bridge between your TM1 cubes and your Power BI workspace. It doesn't just move data; it translates the complex multi-dimensional hierarchy of the TM1 cube natively into Power BI.

For IT, this means zero batch scripts to maintain, no intermediate SQL databases to host, and a dramatic reduction in technical debt during the migration process.

Real-Time Visibility for the CFO

Real-Time Dashboards

When you remove the CSV bottleneck, the entire dynamic of the finance department shifts. The CFO is no longer looking at historical snapshots.

With Datafusion, as soon as a budget allocation is updated in the IBM Planning Analytics Workspace, that change is immediately streamable to the executive Power BI dashboard. It enables true, real-time strategic agility.

In 2026, navigating market volatility requires immediate data access. By integrating your migration strategy with native API connectors, you ensure that your investment in IBM Planning Analytics directly translates into faster, more accurate executive decision-making.

Strategic Alignment: Migrating without a clear reporting integration plan is a recipe for project failure. Datafusion ensures that your stakeholders get the visual dashboards they expect on day one.

The Bottom Line

Don't let legacy reporting pipelines throttle the power of your new cloud architecture. The Datafusion Connector is the blueprint for connecting IBM Planning Analytics to Power BI without the friction.

We built a live environment where you can see exactly how this integration functions in real time.

Line

What is IBM Planning Analytics? Ending the "Month-End" Friction in 2026

Mode_Comment_Icon_black0
Alarm_Icon_14 min

If you are a CFO or an IT Director managing an on-premise financial reporting system in 2026, you already know the pain. IT is spending a disproportionate amount of the week maintaining local servers and dealing with version control conflicts in legacy Excel add-ins. Meanwhile, Finance is battling the exhausting "double-close risk," manually reconciling data across disparate systems and praying a massive VLOOKUP macro doesn't break on day three of month-end.

When leadership asks "what is IBM Planning Analytics?", they are usually looking for a better spreadsheet. But the reality is different: it is an architectural modernization roadmap that finally moves your multi-dimensional data out of the server room, ending the data silos that throttle your financial close speed.

Here is exactly what IBM Planning Analytics (TM1) is in 2026, and why bridging the gap between IT infrastructure and CFO strategy is no longer optional.

It’s an OLAP Database, Not a Spreadsheet

OLAP vs Spreadsheet

At its core, IBM Planning Analytics is powered by the TM1 engine—an in-memory, Online Analytical Processing (OLAP) database.

Most finance teams operate in a 2D world. They build massive, fragile spreadsheets that crash when the row count gets too high, directly causing delays in the month-end close. IBM Planning Analytics replaces that flat architecture with multi-dimensional "cubes". If your FP&A team needs to pivot data by region, product, currency, and time, the TM1 engine calculates it in real-time in memory, rather than forcing a local CPU to process a million rows.

For the CFO, this guarantees data integrity. For IT, it means centralized governance. The logic, rules, and data reside in a single source of truth, not in fifty different versions of a .xlsx file sitting on local desktops.

The Security Shift: By centralizing the business logic in the TM1 engine, you eliminate the risk of sensitive financial data being emailed around or stored on unencrypted local drives. Access is managed via strict, role-based security at the cell level.

The Shift from Perspectives to the Cloud

Cloud Architecture

For years, the standard interface for TM1 was Perspectives—a heavy, locally installed Excel add-in. In 2026, that architecture is a liability.

The modernization roadmap dictates a hard shift to the Cloud. IBM Planning Analytics as a Service (PAaaS) removes the burden of infrastructure maintenance from your internal IT team, while providing the CFO with a platform that natively integrates with existing ERPs without requiring an over-engineered, year-long consulting deployment.

IBM handles the uptime and security compliance, while your finance team interacts with the data via a lightweight web interface (Planning Analytics Workspace) or the modernized Excel add-in (Planning Analytics for Excel).

Real Automation via TI Processes and Agentic AI

Agentic ETL Automation

When vendors talk about AI in finance, they usually mean a basic chatbot. We don't do hype here. The real value of IBM Planning Analytics is how it handles automated data ingestion to eliminate data silos.

Using TurboIntegrator (TI) processes, you can schedule automated data pulls directly from your ERP, CRM, or HR systems. No more manual CSV exports causing reconciliation nightmares.

In 2026, we are pairing this with Agentic AI (via IBM watsonx). These AI agents are authorized to execute workflows. They monitor the TI processes, flag integration anomalies in the ETL pipeline, and can even automatically reconcile discrepancies between systems before the finance team logs in—allowing the CFO to finally trust the accuracy of the AI's financial forecasting.

Integration Architecture: If you are struggling with legacy system connections, Octane's proprietary Datafusion TM1 Connector acts as the middleware, bridging the gap between rigid on-prem ERPs and the IBM Cloud environment without requiring custom API development.

The Bottom Line

Migrating to IBM Planning Analytics isn't just about giving the finance department a new toy. It is a necessary architectural upgrade that reduces IT's technical debt, hardens your data security, and automates the ETL processes that are currently dragging your month-end close to a crawl.

We built a live environment where you can see exactly how the cloud architecture and web workspaces function.

Line

The Cost of Siloed Planning: Why Integrated Planning Matters

Mode_Comment_Icon_black0
Alarm_Icon_17 min

The Cost of Siloed Planning: Why Integrated Planning Matters

The case for integrated planning — and why AI makes the absence of it more dangerous, not less.

There's a story I use when I'm talking to CFOs about integrated planning. It's not a hypothetical. It's a company called Cochlear — a publicly listed medical device business. In a single trading day, the company lost approximately 40% of its market value recently.

siloed_data_market_crash_artwork

The reason wasn't fraud. It wasn't a product failure. It was a disconnect. Sales were declining. Inventory was building. The two facts were sitting in different systems, owned by different teams, measured against different KPIs. Nobody connected the dots in time. The market did.

When I ask CFO audiences how many of them are operating with the same structural vulnerability, the room gets uncomfortable. Because the honest answer, for most mid-to-large organisations, is: yes.

The Silent Risk of Siloed Planning

Most finance functions know they have a data fragmentation problem. What they underestimate is the risk that fragmentation creates — particularly now that AI is being layered on top of it.

Here's the dynamic I see repeatedly: an organisation invests in AI tools to improve forecasting, automate reporting, or generate commentary. The tools are good. But the data feeding them is fragmented. Sales live in one system. Inventory in another. Headcount in a spreadsheet. Finance in the ERP. There's no single connected model that shows the cause-and-effect relationship between these inputs.

When AI is applied to that fragmented foundation, it doesn't fix the fragmentation. It produces confident, well-articulated outputs that are built on incomplete information. That's arguably more dangerous than a spreadsheet, because it has the appearance of rigour.

If you don't have integrated planning — if you don't understand the cause and effect between your departments — you're not ready to layer AI on top of it. That's your baseline.

What Integrated AI Planning Actually Looks Like

I want to give you a concrete picture, because 'integrated planning' is a term that gets used loosely. Let me describe what we built for one of the investment banks in our client portfolio — a globally operating institution with more than 800 legal entities and over 1,000 active users of the planning application.

When we started the engagement, their budget cycle took two months. By the time it was complete, it was already out of date. Rolling forecasts — the aspiration — were impossible at that cadence.

After implementing a properly integrated planning environment, with AI infused across the workflow, they can now complete a rolling forecast in four to six days. More importantly, the system responds to real-world events. When macro conditions shift — supply chain disruption, geopolitical instability, commodity price movement — the model recalibrates. Frontline decision-makers get live insight, not a stale plan from last quarter.

75%+

Reduction in forecast cycle time — from 2 months to 4-6 days
800+ global entities, 1,000+ users

The Four Things AI Planning Actually Delivers

When integrated planning is working properly, with AI layered appropriately, it delivers four things that individually sound incremental but together are genuinely transformational:

  • One version of the truth. Sales, inventory, cash flow, and headcount in a single connected model, updated in near real time. This alone eliminates the majority of the reconciliation work that consumes analyst capacity.
  • A forecast that responds. Market events auto-trigger scenario recalculation. You're not waiting for the next planning cycle to understand the impact of a supply chain disruption. You know within hours.
  • AI-generated commentary. Variance explanations and board narratives written by AI, reviewed and approved by your team. The AI has access to the transaction history, the drivers, the period comparisons — and it generates commentary that is, frankly, more consistent and complete than what most analysts produce under time pressure.
  • Early warning signals. Anomaly detection that surfaces the Bioventus-style blind spots before they become headlines. The inventory building while sales decline scenario — that gets flagged, automatically, before the market figures it out.

Why the Spreadsheet Will Not Save You

I want to be clear about something: I'm not dismissing the sophistication of finance teams who have built complex Excel environments. Many of them are genuinely impressive pieces of engineering. But they have a structural limitation that AI cannot fix: they are disconnected by design.

A spreadsheet that sits in finance doesn't know what's happening in supply chain. An Excel model in the sales team doesn't feed into the headcount plan. The connections are manual, maintained by people, and dependent on someone remembering to update something. When that person is on leave, or when they leave the business, the connections break.

Integrated planning replaces those manual connections with a live data model. AI then operates on top of that model — not on top of a series of disconnected files.

Where to Start

If you're reading this and recognising your own organisation in the description above, the path forward is cleaner than it might seem. In our experience, the most effective starting point is not a full transformation program — it's a targeted proof of concept that connects two or three currently disconnected planning domains and demonstrates what a live, integrated model looks like.

Once the board and leadership team can see a rolling forecast that updates automatically when assumptions change, the conversation about broader transformation becomes significantly easier.

The Cochlear story is an extreme example. But the structural vulnerability it illustrates is common. And with AI amplifying the outputs of whatever data foundation you're sitting on, the cost of not addressing it is rising.

In the next blog in this series, I'll address something most CFOs are completely unaware of: the cost of AI tokens — and why it's about to become a CFO-level line item.

Amendra Pratap is the Founder and Managing Director of Octane Solutions, an IBM Gold Partner specialising in AI-powered finance transformation across Australia, New Zealand, and the Pacific.

Line

The Enterprise Knowledge Crisis, And Why Agentic AI Is the Only Answer That Scales

Mode_Comment_Icon_black0
Alarm_Icon_115 min

The Problem Every C-Suite Recognises but Few Have Solved 

Your organisation is not short on information. 

After a decade of digital transformation, most enterprises have built expansive repositories: policies, contracts, procedures, compliance frameworks, knowledge bases, operational runbooks, HR documentation, supplier records, regulatory filings. These assets represent years of institutional knowledge and millions of dollars of accumulated investment. 

And yet, when an employee needs an answer, a real, accurate, contextual answer, they still open a search bar, scroll through folders, send an email, or wait for a reply. 

The information exists. The problem is access, context, and trust. 

McKinsey research estimates that knowledge workers spend an average of 1.8 hours every day searching for and gathering information. Across an enterprise of 10,000 employees, that is the equivalent of over 3,000 people doing nothing but searching, every single day. 

This is not a content management failure. It is a knowledge operationalisation failure. And it is costing organisations far more than they realise. 

The questions being asked every day inside your organisation reveal the gap plainly: 

  • What policy applies to this situation? 

  • Who approves this request, and at what threshold? 

  • What compliance obligations apply to this transaction? 

  • Which supplier holds the preferred contract? 

  • What is the current version of this document? 

  • Has this issue been resolved elsewhere in the business? 

The answers exist, buried in documents that were designed to be stored, not used.

"Most enterprise knowledge is archived. Very little of it is operationalised. This is the gap that Agentic AI is uniquely built to close."

From Content Management to Knowledge Intelligence: A Strategic Shift 

Traditional enterprise platforms were designed to store information. Agentic AI is designed to understand it. 

This distinction matters enormously at the C-suite level. The shift is not incremental, it is architectural. 

Instead of asking employees to navigate folder structures, keyword searches, and disconnected repositories, an intelligent AI agent allows them to ask a question in plain language and receive an accurate, contextual, source-cited answer in seconds. The experience moves from: 

"Search and hope you find the right document." 

to 

"Ask and receive a trusted, actionable answer." 

This is not another chat interface or search upgrade. It is a fundamental change in how enterprise knowledge becomes a business asset, one that informs decisions, reduces risk, accelerates operations, and scales without adding headcount. 

At Octane, we have helped organisations make exactly this transition. We build intelligent AI agents that transform enterprise content into a conversational, governed, and actionable knowledge layer, one that answers questions, interprets policies, generates insights, and orchestrates business processes at scale.

What Separates Agentic AI from Everything That Came Before 

Most organisations have experimented with Generative AI. Many have built chatbots, piloted copilots, or deployed search enhancements. Most of these initiatives delivered limited value and stalled at the proof-of-concept stage. 

The reason is simple: they were designed to generate content, not to reason about it. 

Agentic AI operates at a fundamentally different level. The shift from generative tools to enterprise-grade agents requires architectural foresight, business alignment, and strict governance, not just better models. 

An enterprise AI agent does not simply retrieve a document. It:

  • Understands the intent behind a question 

  • Searches across the enterprise knowledge corpus 

  • Interprets policies, procedures, and obligations in context 

  • Evaluates the user's role, location, and permissions 

  • Applies relevant business rules and thresholds 

  • Generates a clear, precise recommendation 

  • Cites authoritative sources for every claim 

  • Executes actions or triggers downstream workflows 

  • Escalates to human reviewers when confidence is insufficient 

  • Learns and improves from each interaction 

The result is not another search tool. It is a trusted digital colleague, one available to every employee, across every department, at every hour. 

The Architecture Behind Enterprise-Grade Accuracy

Here is where strategy meets engineering, and where most AI initiatives fail. 

Building a basic AI assistant is straightforward. Building one that consistently delivers accurate, auditable, and reliable answers at production scale is substantially harder. 

Any technical research will show that, the gap between a working prototype and a trusted enterprise platform spans multiple engineering disciplines: document preparation, intelligent chunking, hybrid retrieval strategies, domain alignment, continuous evaluation, and governance controls. 

Most enterprise knowledge was never created with machine readability in mind. PDFs contain tables that break during extraction. Scanned documents carry OCR errors. Policies are written in deliberately broad language. PowerPoint decks rely on visual flow rather than explanatory text. Multiple conflicting versions of the same document often coexist. 

A simple AI pipeline ingests all of this without discrimination. A production-grade Agentic AI system cannot afford to. 

The difference between a 60% accuracy system and a 95% accuracy system, the threshold at which enterprise trust is established, lies in five areas:

Data Preparation: Normalised formatting, semantic chunking, rich metadata tagging (ownership, jurisdiction, effective date), and active deduplication of conflicting content. 

Intelligent Retrieval: Hybrid search combining vector similarity with keyword matching. Dynamic chunk sizing. Re-ranking models calibrated to your domain. Query rewriting and expansion. Retrieval defines the boundaries of truth; improving it delivers larger gains than upgrading the model itself. 

Domain Alignment: General-purpose language models are fluent but not domain experts. High-accuracy enterprise systems include domain-tuned models, precisely engineered system prompts, and explicit constraints that ground answers in verified organisational sources. 

Continuous Evaluation: Accuracy is not achieved once. It requires ongoing measurement against real user queries, expert-validated ground truth, multi-dimensional response grading, and regression testing after every content or configuration change. 

Governance by Design: In enterprise and regulated environments, accuracy alone is insufficient. Every response must be explainable, traceable, auditable, and governed. This is the bar that separates pilots from platforms. 

The Octane Delivery Model: Powered by IBM watsonx 

Octane delivers Agentic AI solutions built on IBM's enterprise-grade AI platform, watsonx Orchestrate, giving your organisation access to one of the most capable and governed AI ecosystems available today. 

At the centre of this ecosystem is IBM's Agent Catalogue: a central hub that makes it easy to discover, deploy, and orchestrate specialised AI agents built by IBM and its global partner network. These agents are framework-agnostic, meaning they can be built with any modern development stack and integrate seamlessly with the watsonx Orchestrate environment. 

Through IBM Agent Connect, Octane's specialised agents integrate directly into your watsonx environment, delivering pre-built capabilities focused on specific business domains, with the productivity enhancements and process simplifications your teams need from day one. 

This architecture means your Agentic AI investment is not a bespoke, isolated prototype. It is built on an open, scalable platform backed by IBM's global enterprise infrastructure, security frameworks, and partner ecosystem, reducing time to value while maximising long-term extensibility. 

Where Agentic AI Delivers Measurable Business Impact

Agentic AI is not a horisontal technology looking for a problem. It is a targeted capability that delivers measurable outcomes in specific, high-value enterprise domains.

Human Resources & Employee Experience 

Employees spend significant time searching for HR information or waiting days for responses to routine questions. An intelligent HR agent answers instantly and consistently:

"What parental leave am I entitled to in my region?" "Can I carry over unused annual leave this year?" "What is the reimbursement limit for international travel?"

The agent interprets policies, applies regional requirements, and delivers cited responses, reducing HR support workload, accelerating onboarding, and improving employee experience at scale.

Governance, Risk & Compliance 

Compliance creates value only when employees understand and follow it, a condition that is remarkably difficult to sustain across large organisations.

"Can I share this customer record with a third-party vendor?" "What approvals are required before signing this agreement?" "Which privacy obligations apply to this process?"

The agent reviews applicable policies, interprets requirements in context, and provides evidence-backed guidance, reducing violations, accelerating decisions, and creating a defensible audit trail. 

Finance Operations 

Finance teams operate across thousands of transactions, controls, and approval frameworks. Manual policy lookup is a bottleneck that compounds across every department.

"What approval is required for capital expenditure over $50,000?" "Which expense category should this purchase be assigned to?" "What is our current policy on FX hedging for subsidiary transactions?"

Immediate, accurate answers reduce approval delays, improve policy compliance, and strengthen financial governance. 

Procurement & Vendor Intelligence 

Procurement teams manage complex supplier ecosystems across contracts, SLAs, ESG obligations, and preferred vendor registers.

"Who is our preferred cloud infrastructure vendor in APAC?" "What service levels apply to this support contract?" "Which of our current suppliers are certified against our ESG requirements?"

The agent retrieves answers directly from contracts, supplier records, and procurement policies, accelerating cycles and improving compliance. 

Customer Service & Contact Centre 

Service agents lose significant time searching internal systems for product information, escalation paths, and policy guidance. Agentic AI delivers that knowledge in real time, reducing handling times, improving first-contact resolution, and lowering operational costs without increasing headcount. 

Healthcare & Clinical Operations 

Healthcare professionals require immediate access to clinical protocols, pre-operative requirements, and compliance obligations. Agentic AI delivers approved guidance instantly, improving patient safety and reducing administrative burden. 

The Business Case: A Quantified Return 

Organisations implementing enterprise Agentic AI knowledge platforms consistently achieve: 

Business Outcome

Typical Impact

Employee search time reduction

4.5+ hours saved per employee per week

Support ticket deflection

20–40%

Support team productivity

14–15% improvement

Issue resolution speed

30–50% faster

Overall employee productivity

5%+ improvement

Policy compliance consistency

Measurable governance uplift

Decision speed

Significant reduction in knowledge latency

For a mid-size enterprise of 5,000 employees, 4.5 hours saved per employee per week represents approximately 22,500 hours of recovered productive capacity, every week. 

The question is not whether the ROI justifies the investment. The question is how quickly you can move from assessment to deployment.

The Octane Approach: From Strategy to Scale 

Most AI consulting firms help you define a strategy. Octane helps you execute one. 

We have won multiple global awards for transforming businesses through Agentic AI, not through theoretical frameworks, but through delivered systems that operate in production environments across regulated industries including Financial Services, Healthcare, Government, Telecommunications, and Critical Infrastructure. 

Our engagement model is structured to move organisations from curiosity to capability at pace. 

AI Strategy & Opportunity Assessment 

We identify where Agentic AI creates the highest measurable value in your specific organisation, grounded in your data, your processes, and your competitive position. Not generic use cases. Your use cases. 

Agent Design & Architecture 

We design agents that are grounded in your business processes, governance requirements, and operational realities. Every agent is built with explainability, auditability, and scalability as first-class requirements, not afterthoughts.

Enterprise Integration 

We connect agents to your existing business systems: ERP, CRM, HRIS, document management, workflow platforms, and operational data sources. Agents that cannot operate within enterprise systems cannot scale.

Enablement & Knowledge Transfer 

We do not gatekeep. Our enablement programs are designed to transfer knowledge, skills, and confidence to your team, so that your organisation does not just use AI, but owns it. From technical deep dives to executive briefings, every session is tailored to your team's goals and capability level. 

Governance, Security & Trust 

Every solution Octane delivers is secure, auditable, explainable, and enterprise-ready. We build governance by design, not compliance as an afterthought. This is non-negotiable in regulated environments and increasingly expected in every sector. 

Scale & Optimisation 

We expand from a proven first use case into an enterprise-wide Agentic AI operating model, one that evolves as your business evolves.

What Your Organisation Could Build

Whether the priority is a single high-impact agent or an enterprise-wide knowledge platform, Octane has the capability, methodology, and platform partnerships to deliver it: 

  • Ask HR, Employee policy and entitlement advisor 

  • Ask Finance, Approvals, expense, and financial policy assistant 

  • Corporate Policy Advisor, Governance and compliance intelligence layer 

  • Procurement Assistant, Supplier, contract, and vendor intelligence 

  • Compliance Advisor, Regulatory obligation and risk guidance 

  • Legal Knowledge Agent, Contract interpretation and escalation 

  • Service Desk Assistant, Internal IT and operations support 

  • Enterprise Ask-Me-Anything Platform, Unified knowledge access across the organisation 

The goal across every one of these is the same: 

Transform information into action. Transform content into decisions. Transform knowledge into competitive advantage.

Three Ways to Engage Octane

We meet organisations wherever they are in their Agentic AI journey. 

Discovery Workshop: A structured half-day or full-day session to map your highest-value AI opportunities, assess your knowledge estate, and define a prioritised roadmap. Designed for leadership teams ready to move from awareness to action. 

Enterprise Readiness Assessment: A comprehensive evaluation of your data, governance, technology, and organisational readiness for Agentic AI at scale. Delivers a detailed implementation blueprint with defined business cases and ROI projections. 

Agentic AI Implementation: End-to-end delivery of your first production-grade AI agent, from design and integration through deployment, evaluation, and enablement. Built on IBM watsonx Orchestrate. Designed to scale. 

The Organisations That Move First Will Move Furthest

The competitive dynamics of Agentic AI are not symmetrical. 

Organisations that deploy trusted, production-grade knowledge agents over the next 12 to 18 months will accrue structural advantages: faster decision-making, lower operational costs, stronger governance, and institutional knowledge of what works at scale in their industry. 

Organisations that wait will face a widening gap, not just in technology, but in organisational capability and institutional confidence. 

The question is no longer whether your organisation has the information it needs. 

The question is whether your people can access it, trust it, and act on it, at the speed your business demands. 

Octane builds the bridge. 

Ready to Begin? 

Discover how Octane can transform your enterprise knowledge, policies, procedures, and operational content into a governed, intelligent, AI-powered platform that delivers measurable value across the entire organisation.

Book a Discovery Workshop → Request an Enterprise Readiness Assessment → AI Implementation Roadmap by an Agentic AI Specialist


Octane is an award-winning Agentic AI consulting firm specialising in strategy, agent design, enterprise integration, and organisational enablement. Our solutions are built on IBM watsonx Orchestrate, one of the world's most capable and governed enterprise AI platforms.

Line

TM1 vs Power BI: When to Use Each

Mode_Comment_Icon_black0
Alarm_Icon_117 min

If you are comparing TM1 and Power BI, you are asking the wrong question.

These are not competing products. They solve fundamentally different problems. TM1 is a planning engine, and Power BI is a visualisation platform. Comparing them is like comparing an engine to a dashboard: one produces the power, and the other displays the information.

The real question is: when do you use each, and how do you connect them?


The Core Difference in One Sentence

TM1 writes data. Power BI reads data.

That is the entire architectural divide in eight words.

IBM Planning Analytics (TM1) is a database where finance teams build budgets, run forecasts, and model scenarios. Users actively put data into TM1 (assumptions, targets, adjustments), and the engine calculates everything downstream in real time.

Microsoft Power BI is the opposite motion. Analysts pull data out of systems and present it through dashboards and reports. Users consume data in Power BI; they explore it, but they do not typically change it.

Once you understand this distinction, everything else falls into place.

Feature Comparison

Capability

IBM TM1 (Planning Analytics)

Microsoft Power BI

Primary Function

Planning, budgeting, forecasting, modelling

Reporting, visualisation, dashboarding

Data Direction

Read + Write (bidirectional)

Read-only (native)

Engine Type

In-memory OLAP database

Analytical / visualisation engine

Data Modelling

Multidimensional cubes, rules, TI scripting

Tabular models, DAX, Power Query

Excel Integration

Native bidirectional (PAfE)

Export/embed only

User Input

Core feature (data entry, allocations, approvals)

Not native (requires third-party add-ons)

Scenario Modelling

Sandboxes, versions, real-time what-if

Limited without writeback tools

Licensing

Enterprise subscription

Per-user subscription (Pro/Premium)

Ease of Use

Moderate (requires TM1 expertise)

High (self-service, drag-and-drop)

Best For

Finance teams managing complex plans

Organisation-wide data consumption


When to Use TM1

TM1 is the right choice when your team needs to create, manage, and calculate financial data, not just look at it.

Budgeting and Forecasting

This is TM1's home turf. Multi-entity budgets, rolling forecasts, and driver-based planning models are its strengths. Finance users input their assumptions, and TM1 calculates the downstream impact across every cost centre, region, and business unit in real time.

We have seen teams try to build budgeting workflows inside Power BI using SharePoint lists and Power Automate. It works for about three months until someone needs a version comparison, a conditional allocation, or an approval workflow that does not break when someone edits the wrong row. That is when the call comes in.

Power BI has no native mechanism for users to input budget data, define calculation rules, or run scenario models. It was never designed to.

Financial Consolidation

Multi-entity consolidation with intercompany eliminations, currency translation, and minority interest adjustments is core TM1 territory. If your organisation operates across legal entities (subsidiaries, joint ventures, regional holding companies), TM1 handles the consolidation hierarchy natively. Data aggregates from leaf-level entities upward through the legal structure automatically.

Cost Allocation

Distributing shared costs (IT overhead, corporate services, facility expenses) across departments based on calculated drivers is the kind of multi-step, cascading logic that TM1's rule engine was built for. Try replicating that in DAX and you will understand why TM1 developers exist.

What-If Analysis

TM1's sandbox feature lets analysts create personal "what-if" scenarios without touching the base data. Best case, worst case, and management case all run simultaneously with instant comparison. It is the feature that finance teams never know they need until they have it, and then they cannot live without it.

When to Use Power BI

Power BI is the right choice when your organisation needs to see, explore, and share data across every department, not just finance.

Executive Dashboards

This is where Power BI genuinely excels and TM1 does not pretend to compete. Power BI transforms raw data from ERP systems, CRM platforms, databases, and spreadsheets into interactive visual dashboards that look professional and update in real time. The drag-and-drop interface means non-technical users can build their own views. Furthermore, the Microsoft 365 integration (embedding dashboards in Teams, SharePoint, and email) is seamless in a way that no other BI tool has managed to match.

If your CEO needs a single screen showing revenue, pipeline, headcount, and customer satisfaction, Power BI is the tool.

Self-Service Reporting

Business users across every department (sales, marketing, operations, HR) can build their own reports in Power BI without waiting for an analyst to queue it up. The DAX formula language is surprisingly deep, and Power Query handles data transformation well enough that most business analysts can be self-sufficient within a few weeks.

TM1 can produce reports, but it is designed for the finance team. Power BI is designed for everyone else.

Organisation-Wide Distribution

Power BI Pro starts at approximately $10/user/month. That makes it commercially viable to give hundreds or thousands of people access to live dashboards. TM1's licensing model is built for the smaller, specialised teams who actively build and manage planning models, typically 10 to 50 users. If you need 500 people looking at data, Power BI wins on cost alone.

Cross-Source Analysis

Power BI natively connects to over 150 data sources. Pulling data from SAP, Salesforce, Oracle, SQL databases, and flat files into a single visual layer is one of its strongest capabilities. For organisations with fragmented data landscapes (which is most organisations), this alone justifies the investment.

The Real Answer: Use Both

In most mature enterprise environments, TM1 and Power BI are not competing. They are running in sequence:

Source Systems → TM1 (Planning + Modelling) → Power BI (Visualisation + Distribution)


TM1 handles the heavy lifting: complex financial calculations, budget collection, forecast modelling, and scenario analysis. It is the engine room where 15 finance professionals build and maintain the models that drive the business.

Power BI handles the presentation: transforming TM1's output into polished dashboards for the 200 executives, managers, and analysts who need to see the results but never need to touch the model.

This architecture gives you:

  • The modelling depth and writeback capability of TM1


  • The visual accessibility and distribution reach of Power BI


  • A single governed source of truth for all planning data

The question becomes: how do you actually connect them?

The Integration Challenge

Connecting TM1 to Power BI has historically been harder than it should be.

TM1 stores data in multidimensional cubes, while Power BI expects flat, tabular data. The traditional approach (exporting CSVs from TM1, moving files to a staging folder, importing them into Power BI) is manual, fragile, and destroys the real-time value of both platforms. Version mismatches, stale data, and reconciliation headaches are common. We have seen finance teams burn entire afternoons on this every reporting cycle.

Common Integration Approaches

Method

Pros

Cons

CSV/Excel Export

Simple, no setup

Manual, error-prone, no real-time

TM1py (Python API)

Flexible, customisable

Requires developer skills, ongoing maintenance

ODBC/SQL Staging

Standardised, widely understood

Adds complexity, latency, and another database to manage

DataFusion Connector

Real-time, low-code, no staging DB

Purpose-built for TM1


Why We Built DataFusion

We built the DataFusion connector because we kept seeing the same pattern across client engagements: a finance team with a perfectly functioning TM1 model, and a leadership team that could not see any of it because the Power BI connection was held together with CSV exports and a prayer.

DataFusion connects directly to TM1 cubes via the REST API, extracts multidimensional data, and serves it to Power BI in real time. There is no intermediate database, no custom ETL scripts, and no TM1 development skills required.

How it works:

  1. DataFusion connects to your TM1 server via the REST API.

  2. You select the cube and the data you need through a visual interface.

  3. DataFusion extracts and flattens the data for Power BI consumption.

  4. Power BI connects to DataFusion as a standard data source.

  5. Dashboards update automatically as TM1 data changes.


The result: your finance team works in TM1, and your executives see the results in Power BI. No one exports a CSV ever again.

Decision Framework

Your Priority

Use This

Building budgets and forecasts

TM1

Visualising financial results

Power BI

Users inputting data

TM1

Organisation-wide reporting

Power BI

Complex allocation models

TM1

Combining data from 10+ sources

Power BI

Scenario modelling and what-if

TM1

Self-service analytics

Power BI

Both planning AND visualisation

TM1 + Power BI + DataFusion


See It Working

If your organisation runs TM1 and Power BI (or is considering both), we can show you how DataFusion bridges them in real time. No staging databases, no CSV exports, and no custom code.

Start your 60-day free trial now!

Octane Software Solutions is an IBM Finance & AI Partner with 90,000+ hours of TM1 experience across 100+ enterprise projects.

Line

Mastering TM1DISTINCT: The Smart Way to Clean Up Your MDX Subsets

Mode_Comment_Icon_black0
Alarm_Icon_18 min

IBM TM1 models can get messy fast, especially when you use alternate hierarchies and elements show up in multiple places. That's where the TM1DISTINCT MDX function quietly saves the day. Instead of blindly stripping out anything that "looks" duplicated, it understands TM1's hierarchies and only removes true duplicates – the exact same member in the exact same context

The Problem: Why Regular DISTINCT Isn't Enough

Imagine you're building a dynamic subset of Products. You pull all products under All Products, then union it with a special "Focus Products" consolidation. Now some products appear twice in the raw result. With the classic DISTINCT, TM1 might collapse these duplicates in a way that hides the structure you actually care about.

This is especially problematic when working with:

  • Alternate hierarchies that place elements in multiple logical positions

  • Union operations that naturally generate overlapping sets

  • Complex dimension structures where the same leaf element has different parents

  • Dynamic subsets that combine multiple source sets.

TM1DISTINCT is smarter: it keeps the element where it appears in different meaningful places, and only cleans up genuine duplication caused by unions or repeated logic.

Understanding TM1DISTINCT vs DISTINCT

The key difference lies in context awareness:

  • DISTINCT: Removes any duplicate entries that match another entry based on the member name. This can accidentally collapse elements that appear legitimately in different branches of the hierarchy.

  • TM1DISTINCT: Removes duplicates only when they are truly identical – same element, same hierarchy path, same context. It respects the multi-hierarchical nature of TM1. 

While the existing DISTINCT function removes duplicate elements from a set, the new TM1DISTINCT function removes duplicate members only if they are truly identical, including their parent context. This distinction is important because a single element can appear as multiple members in a hierarchy if the element has different parents.

This distinction becomes critical when your dimension design intentionally places elements in multiple locations for different analytical views.

Practical Examples

Example 1: Basic Leaf-Level Filtering

TM1DISTINCT( 
TM1FILTERBYLEVEL( 
{Descendants([Product].[All Products])}, 


)
Here, you get a clean leaf-level list of products, free of accidental duplication, but still faithful to how the hierarchy is built. The function returns all leaf-level descendants while removing any technical duplicates that might arise from the query logic.

Example 2: Combining Multiple Sets (Union Scenario)

TM1DISTINCT(
{ TM1SubsetAll([Customer]) + [Customer].[Key Accounts] }
)

You end up with each real customer only once, even though "Key Accounts" is already part of the full customer list. This is where TM1DISTINCT truly shines – it preserves your intentional hierarchy structure while cleaning up the noise.

Example 3: Alternate Hierarchy Preservation

TM1DISTINCT(
TM1FILTERBYLEVEL(
{Descendants([Cost Center].[Total Company])},
0
)
)

Leaf-level cost centers under Total Company are returned, and any technical duplicates from unions or repeated selection logic are cleaned up safely. The alternate hierarchy placements remain intact.

Real-World Impact

Consider a retail company with a Product dimension that has both:

  • A Standard Hierarchy: All Products → Category → Subcategory → SKU

  • An Alternate Hierarchy: All Products → Channel → Brand → SKU

The same SKU (say, "Blue Shirt Medium") legitimately appears under both "Subcategory" and "Brand." Using DISTINCT here might collapse one of these occurrences, breaking reporting by channel. Using TM1DISTINCT keeps both occurrences because they represent different analytical contexts. 

Best Practices

  1. Use TM1DISTINCT when building dynamic subsets that combine multiple sets or work with alternate hierarchies

  2. Avoid it only for simple, single-hierarchy subsets where standard DISTINCT would work fine

  3. Combine with TM1FILTERBYLEVEL to ensure clean, context-aware filtering

  4. Test with your actual dimension structure to verify the results match business expectations.

Conclusion

TM1DISTINCT represents a maturation of MDX handling in Planning Analytics, acknowledging that TM1's rich hierarchy support requires intelligent de-duplication. By using it in your dynamic subsets, you ensure clean data without sacrificing the intentional structure your dimensions are built upon. Your business users – and your data model – will thank you for it.

References

  1. IBM Planning Analytics Documentation. (2024). TM1DISTINCT( <set> ). IBM. https://www.ibm.com/docs/en/planning-analytics/3.1.0?topic=tsmf-tm1distinct-set

  2. IBM Planning Analytics. (2024). TM1 specific MDX functions. IBM. https://www.ibm.com/docs/en/planning-analytics/2.0.0?topic=mfs-tm1-specific-mdx-functions

Line

Your Finance Team Loses 6–10 Days Every Month. Agentic AI Wants Them Back.

Mode_Comment_Icon_black0
Alarm_Icon_19 min

 How Octane FastClose is turning the month-end grind into a managed, automated, and human-controlled process — live today. 

Every month, without fail, your finance team disappears. Not on a retreat. Not on holiday. They vanish into the black hole of financial close — a gruelling 6 to 10 day sprint of spreadsheets, exception chasing, manual journal entries, and last-minute reconciliations.

The statistics paint a stark picture. It is 2026, and teams are still copy-pasting between three systems to reconcile cash.


Octane FastClose was built to change that.

Why the Close Is Still Broken

The month-end close has a structural problem that more people, more spreadsheets, and even basic automation cannot solve. It is a multi-system, multi-team, multi-judgement process where every delay compounds and every error multiplies.

The core pain points are well known to any controller who has lived through them:

  • Manual reconciliations eat 30+ hours per month, with data spread across GL, ERP, sub-ledgers, and bank feeds that rarely agree.

  • Journal entries drafted in Excel, reviewed over email, and posted manually — slow, error-prone, and almost impossible to audit cleanly.

  • Variance analysis is produced in isolation, without the system context to explain whether a movement is a product launch spike or a genuine anomaly.

  • The "last mile" problem — chasing approvals, resolving intercompany disputes, and writing executive narratives that could have been automated from the data itself.

RPA helped with repetitive tasks. But RPA cannot reason. It cannot distinguish a genuine anomaly from a normal pattern shift. It cannot draft a correcting journal entry, present it for approval, and post it to the GL — all in one unbroken flow.

Traditional automation has hit its ceiling. The close needs something that thinks.

 
"67% of finance leaders say the close process is their team's single greatest source of month-end stress. The average mid-market close takes 6–10 business days. Errors in manual journal entry are a leading cause of restatements and audit findings."
 — CFO Survey, 2026

Enter Agentic AI — And Why It Is Different

Most finance teams have already encountered AI in the form of chatbots and copilots. These tools are useful. They answer questions, summarise documents, and draft commentary. But they are fundamentally passive — they wait to be asked. They do not act.

Agentic AI is built on a different principle. An AI agent is designed to pursue goals autonomously — planning a sequence of steps, executing each one, assessing the result, and adapting. Applied to month-end close, this means an agent that does not just tell you there are 235 unallocated transactions. It identifies them, proposes the correct cost centres, presents a summary for your approval, and then posts the journals. The agent is a participant in the close process, not a bystander.

This is the architecture behind Octane FastClose.

Meet the FastClose Agents

FastClose deploys a team of specialist AI agents, each owning a defined piece of the close. A Master Orchestrator coordinates them — sequencing tasks, routing exceptions to humans, and learning from every cycle.

🔍 Recon Agent

Automatically matches intercompany, bank, and sub-ledger reconciliations. When a break occurs, it performs root-cause analysis and flags it — with context — for human review.

📝 Journal Entry Agent

Drafts accruals, reclassifications, and adjusting entries based on transaction patterns and accounting policy rules. Every proposed journal is presented for controller approval before posting.

📈 Flux Agent

Runs variance analysis and generates plain-English narratives explaining what drove P&L movements — automatically, at the moment the numbers are available.

🏢 Consolidation Agent

Handles intercompany eliminations, FX translation, and minority interest calculations across entities — the work that typically consumes a disproportionate share of the close for multi-entity groups.

✅ Validation Agent

Runs 200+ data integrity checks, SOX control assertions, and close readiness scoring. Surfaces issues before they become audit findings.

The Human Stays in Control — By Design

The most common concern we hear from finance leaders is governance. If the AI is making decisions, who is accountable?

FastClose answers this directly. The agent is not a decision-maker. It is an expert preparer.

Every proposed journal entry, every cost centre assignment, every reforecast scenario, and every period lock is gated behind an explicit human approval. The controller sees what the agent proposes, reviews the supporting analysis, and approves or rejects. The agent then acts on that instruction.

Every step is logged. Every decision — including rejections and revisions — is recorded in a full audit trail. Segregation of duties is maintained. The result is a close that is not only faster but more controlled and more auditable than the manual process it replaces.

The FastClose Principle: "The agent does the work. The controller makes the call."

FastClose is a force multiplier for your finance team — not a replacement for it.

Where FastClose Is Today

FastClose is not a prototype. It is a live, production-deployed system. Fifteen of the thirty-two tasks in the full close cycle are operational today, spanning all seven phases of the close.

The roadmap extends to intercompany reconciliation, automated accruals, fixed asset depreciation, bank reconciliation, balance sheet movement analysis, and a full close task board — all gated by human approval at every material step.

Why Now Is the Right Time

Finance functions that wait for agentic AI to become mainstream before acting will find themselves a full close cycle behind their peers.

The technology is mature enough to deploy reliably today. The organisations piloting these capabilities now are compressing close timelines, redeploying analyst time to higher-value work, and building institutional knowledge in governing AI-assisted financial processes.

Critically, adopting FastClose does not require replacing your ERP, restructuring your team, or undertaking a multi-year transformation programme. It is designed to work alongside your existing systems — starting with the highest-impact, most automatable tasks and expanding coverage progressively as your team builds confidence in the model.

See FastClose in Action

Join us at our upcoming live event to see the agent run a full month-end close in real time — on real data, with live approvals.

Line

What's new in Cognos Analytics 12.1.x

Mode_Comment_Icon_black0
Alarm_Icon_121 min

Dashboards: 

Distinction between Display and Use value in dashboards: 

You can now define Display and Use values in data modules. 

The Display values are the values that you can see in a dashboard UI; the Use values are primarily for filtering logic. 

Previously, defining the Display and Use values was possible only in FM packages. This feature brings the same capability to data modules and enhances consistency across dashboards and reporting. You can interact with readable values while filters apply precise underlying identifiers. For example, you can select a Customer ID value in the dashboard UI and apply a filter that is based on the Customer Name value. 


Manage filter size and filter area visibility: 

You can now resize filter columns and hide filter areas to improve the arrangement and visibility of these elements in dashboards. 

For more information on resizing filter columns in the All tabs and This tab filter areas, see Resizing filters. 

For more information on hiding and reshowing the filter areas, see Hiding and showing filter areas. 

Option for users to export visualisation data to a CSV file: 

You can now allow your users to export visualisation data to a .csv file. 

To enable this feature, open a dashboard or a report that contains a visualisation, go to Properties > Advanced, and turn on the Allow users access to data option. 

When this option is active, users can open the data tray and download the .csv file from the Visualisation data tab. Enabling this feature also adds an Export to CSV button and Export to CSV icon to the toolbar. The button is visible to the users and to the editors. If you turn off this feature, the button disappears. 

Responsive dashboard layout: 

The 12.1.1 release introduces a responsive layout feature for dashboards. 

This feature enhances the authoring experience and usability across different devices by optimising the dashboard layout for various screen sizes, including mobile devices. You can also use it for grouping the content and organising visualisations. 

To use a responsive layout, go to the Responsive tab when you create a new dashboard and select one of the available templates, as seen in the following image: 

Dashboard creation screen with the "Responsive" tab selected. Several responsive layout templates are available as options for creating a new dashboard.

The responsive dashboard layout feature comes with the following key capabilities: 

  • Layout selection: 

You can now choose between responsive and non-responsive layouts when you create a new dashboard. 

  • Adaptive widgets: 

If you change the position of a panel or resize the dashboard window, the widget automatically adapts its placement and alignment. 

  • Intuitive resizing and swapping: 

Smart alignment algorithms facilitate smooth layout transitions, while an intuitive interface makes the authoring experience smoother and more efficient. 

  • Drop zones for precise widget placement: 

Each layout cell supports five drop zones: top, right, bottom, left, and center. You can use these zones for more control over widget placement. 

  • Cell deletion: 

Dashboards now differentiate between empty and populated cells for accurate deletion. 

  • Data population: 

The feature mirrors data population from the non-responsive layouts, supports drag-and-drop function, and slot item selection. If you use the copy and paste or click-add-to functions, the feature uses a smart placement logic to make sure that it adds the content to empty cells. It can also split the data between existing cells. 

  • Window resizing: 

You can now dynamically resize a dashboard and its layout automatically adapts to the new screen size. It includes transition to a single-column or two-column layouts on smaller screens for enhanced readability. 

  • Printing to PDF files: 

You can print the dashboard to a .pdf file in View mode and in the New Page mode. 

  • Nested dashboard widgets: 

You can use the nested dashboard widgets as standard widgets or as containers for grouping and organising the content. 

To successfully implement the responsive layout, you must make sure that the dashboard uses manifest version 12.1.1 or later and confirm widget boundaries by employing the layout grid. However, if the widgets do not render correctly, check the layout specification and verify the feature support. 

Secure dashboard consumption with execute and traverse permissions: 

Users can now consume dashboards with execute and traverse permissions granted to presented data, no read permission is required. 

In the previous releases of IBM® Cognos® Analytics, the read permission was required for dashboards consumption. This might cause a sensitive data compromise because dashboard consumers could edit and copy such data. 

Important: To strengthen the protection of data that you want to be consumed by other users, modify these users' permissions from Read to Execute and Traverse before you migrate to Cognos Analytics 12.1.1. 

However, the execute and traverse permissions put some restrictions on actions that can be taken by a dashboard consumer. Therefore, the consumer cannot perform the following actions: 

  1. Drill up and down 

  2. Export 

  3. Narrative insights 

  4. Navigate 

  5. Open dashboards 

  6. Paste copied widgets into another dashboard. 

  7. Pin 

  8. Save 

  9. Save as a story 

  10. See the full data set in the data tray. 

  11. Share 

  12. Switch to Edit mode. 

Personalised dashboard views: 

The 12.1.1 release comes with a new feature for simplified customisation of complex dashboard designs. 

A dashboard view is a feature that references a base dashboard, which contains your individual filters and settings. It supports the following customisation features: 

  • Filters 

  • Brushing, excluding local filters on individual visualisations 

  • Bookmarks, including the ability to set the currently selected tab 

You can create dashboard views only from an open dashboard and from within the dashboard studio, and only against saved dashboards. If the open dashboard is saved, a Save as dashboard view option appears in the save menu: 

Selecting the "Save as dashboard view" option from the save menu.

This operation works as a standard Save as operation. When the operation is complete, the original dashboard is still displayed. To access the new dashboard view, you must open it manually from the content navigation panel. 

The dashboard views have a different icon from regular dashboards. It includes an eye overlay, which is similar to a report views icon: 

A dashboard view icon has an eye overlay, which differentiates it from the regular dashboard icon.

You can customise a dashboard view by changing the brushing, filter, or bookmarks, and then saving the view. However, the dashboard view is essentially in a Consume mode, and you can't switch to the authoring mode. It also means that you can't access the metadata tree of the dashboard view or add extra filter controls to the filter dock. If you want your users to apply filters in a metadata column, you must first add that column to the base dashboard, even if you don't initially select any filter values. 

Any updates that you make to a base dashboard automatically appear in the dashboard view, except for the custom options that you define in the dashboard view itself. You can see the changes the next time that you open the dashboard view. For example, if you delete a visualisation from the main dashboard, it no longer appears in the dashboard view. 

The Save as dashboard view operation also creates a non-editable bookmark in the dashboard view. This bookmark includes the state of filters and brushing that you applied in the dashboard at the time when the dashboard view was created or last saved. When you open the dashboard view and don't select any other bookmark, this bookmark is automatically selected. 

A bookmark with the state of filters and brushing that you applied in the dashboard at the time when the dashboard view was created.

The dashboard views not only consume bookmarks from the base dashboards, but they also can have their own bookmarks. You can create them in the same way as in standard dashboards. The Cognos® Analytics UI differentiates between Shared bookmarks, so all bookmarks from the base dashboards, and My bookmarks, which are bookmarks from the dashboard view. 

A difference in the UI between "Shared bookmarks" and "My bookmarks".

If you delete the base dashboard, you can't open the dashboard view, and its entry is disabled in the content navigation. All attempts to access that dashboard view by entering its URL address directly into a browser result in an error message. Also, the Source dashboard property appears as Unavailable, for example: 

The "Source dashboard" is set to "Unavailable" because the base dashboard has been deleted.

Reporting: 

Enhanced clarity of reporting templates view: 

Release 12.1.1 enhances the user experience of navigating through report templates. 

When you open the Create a report page, it shows only templates that match the Report filter value. This change hides all Active Reports templates by default and makes only the Report templates visible. 

The "Create a report" page has the "Report" filter value applied by default.

You can use the Filter icon to customise your view. To maintain a personalised experience, Cognos® Analytics saves your selection in local storage or by using the cached value. 

This enhancement also comes with upgraded filter labels, which reflect the current filter value, for example: Showing All Templates, Showing Report Templates, or Showing Active Report Templates. 

Manage queries in the report cache: 

You can manage which data queries are included in the report cache to control report performance. 

For more information on the report cache, see Caching Prompt Data. 

For example, queries to data sources that cannot be accessed by all users, user-dependent, might degrade the report performance. 

You can exclude report performance-degrading queries from cached prompt data by setting the value of the Report cache property to No in the query property pane: 

  • In the navigation menu, click Report, then Queries in the drop-down menu. 

  • In the Queries pane, select a query. 

  • In the Properties pane, in the QUERY HINTS section, click the Report cache property. 

  • Select one of the following values: 

  • Default - the query is included in the report cache 

  • Yes - equivalent to the Default value. 

  • No - the query is excluded from the report cache. 

For multi-level queries, this value is transferred from the lowest-level to the highest-level query. 

PostgreSQL audit deployment and model: 

The 12.1.1 release comes with a new capability for enhanced auditing and reporting in environments that use PostgreSQL as the auditing database. 

You can use a dedicated Framework Manager model and a deployment package to run reports against a PostgreSQL audit database. These resources provide a structure for analysing the audit data and creating insightful reports. 

You can access the new samples in the following locations within your installation directory: 

<installation>/samples/Audit_samples/Audit_Postgres 

<installation>/samples/Audit_samples/IBM_Cognos_Audit_Postgres.zip 

To use the PostgreSQL audit samples, make sure to create a data source connection named Audit_PG. 

Master detail relationships with 11.1 visualisations: 

You can use 11.1 visualisations in master detail relationships to present details for each master query item in a consolidated, insightful way. 

For more information on master detail relationships, see Master detail relationships. 

For the 11.1 visualisations as the detail objects, you can now choose if the same automatic value range is used in all visualisation instances in a master detail relationship. You apply your choice to the Same range for all instances of the chart option. To turn this option off or on, perform the following steps: 

  • Select a visualisation for which a master details relationship is created. 

  • In the Data Set pane of this visualisation, click the data item that defines values on the value axis. 

  • In the Properties pane, under GENERAL, click the More icon 3 dots in the filter area right of the Value range property. 

  • In the Value range window: 

  • Select Computed. 

  • Turn off or on the Same range for all instances of the chart option, depending on whether you want to use in the instances the global extrema, the biggest value range of all instances, or the local extrema, the value range of each visualisation. 

Line

Agentic AI in Finance & TM1: Why Everyone’s Suddenly Talking About It

Mode_Comment_Icon_black0
Alarm_Icon_17 min

If you’re a TM1 professional and have been near the finance or FP&A world lately, you’ve probably heard the buzzword of the season: Agentic AI. 

It sounds fancy and must have wondered why suddenly everyone is talking about it, but honestly, it’s just AI that doesn’t sit around waiting for you to poke it. It does things — proactively and automatically. 

And when you mix that with platforms like IBM Planning Analytics / TM1, things start getting interesting. 

Orchestrate


So… What Exactly Is Agentic AI?

Imagine if your TM1 rules, processes, and chores had a brain.

Not just “if X then Y”, but something that can: 

  • Notice something’s off

  • Decide what to do

  • Do it

  • Tell you what it did

  • Learn from the outcome 

That’s, in a nutshell, agentic AI in the TM1 paradigm.

Think of it as giving your FP&A stack its own mini team member — minus the coffee breaks or the usual shenanigans that you’ve to bear with daily.

In practical terms, agentic AI can help rather than just be a buzzword decoration floating around in everyone’s LinkedIn posts or formal/informal conversations.  

I like to highlight below a few basic things - yet very important – that agentic AI is really good at doing: 

1. Automated Data Babysitting (Finally!) 

Every TM1 admin knows the pain: source system changes, missing records, late files… chaos. 

Agentic AI can: 

  • Watch data pipelines for delays
  • Fix formatting issues on the fly for your TI process
  • Alert you before the morning refresh explodes

 Basically, your nightly chore is that you just hired an assistant.

2. “Hey, Something’s Wrong” Alerts (That Make Sense)

Instead of a typical TM1 process error message that looks like it was written in 1995, agentic AI can: 

  • Spot outliers, bad allocations, weird spikes – something you would do manually otherwise
  • Compared to historical patterns
  • Tell you, in plain English, why it’s weird

Something along the lines of: 

“Hey, sales in APAC are 4x higher than normal for Mondays. It could be a missing filter. Want me to check?” 

Yes, please. 

3. Forecasting That Doesn’t Feel Like Guesswork 

Sure, TM1 can forecast, and it can predictive forecast really well. 

But agentic AI can simulate scenarios on its own and recommend the best one. 

Examples: 

  • Auto-build 20+ what-if scenarios
  • Rank them based on risk or probability
  • Push the best one straight into a cube

It’s like giving your CFO a crystal ball… a slightly nerdy one. 

4. TM1 Admin Tasks… Done Automatically 

This is the part TM1 developers love.

Agentic AI can:

  • Fix failing processes

  • Rewrite TurboIntegrator code

  • Clean up unused object

  • Suggest how to reduce the cube size

Admittedly, given it's all subjective, and it's easier said than done, but the possibilities do exist with the more quality data we can ingest and the more we can train the model. 

5. Natural Language Access to TM1 

We’ve already seen this with AI chat Assistant in PAW where instead of navigating a million cubes and views, we can prompt Planning Analytics such as, “Give me gross margin by product for Q3 vs last year and show me drivers of variance.”

And it does it a fine job.

No view-building. No subset drama. No filter pain. 

6. Real-time Decision Automation

Finance teams love workflows and agentic AI is perfect for building the workflows.

It loves automating those workflows.

  • Approve expenses based on policy

  • Kick off TM1 processes when thresholds hit

  • Trigger emails, Teams alerts, Slack actions

  • Update commentary automatically

So instead of actively entering the forecasts or budgets, the agent proactively taking steps to initiate those steps for you. 

With time, we’re only going to see more of:

  • AI agents running close cycles

  • AI agents building dashboards

  • AI agents talking to ERP, CRM, S3, APIs without humans touching integrations

  • AI agents are debugging your model while you sleep 

Why TM1 Specifically Is a Perfect Fit

As we know, TM1 is: 

  • Real-time

  • Calculation-heavy

  • Highly scriptable

  • Connected to everything

  • Used for tons of repetitive work

Which is exactly the playground where agentic AI thrives.  

Plus, TM1 developers are already half-cyborg 😉 with the stuff they automate — agents just take it further. 

 So the biggest takeaway from all of this is that Agentic isn’t coming “in the future”, it's already there! Things are definitely moving and moving at a very fast rate in this space. 

It’s already sliding into FP&A tools, APIs, planning models, and the daily grind of finance teams. If TM1 was the engine, then agentic AI is the turbocharger bolted on top. 

And yes — as a disclaimer, it might even finally stop your chore from failing at 3 AM for no reason 😉 

Line

Octane’s AI Contract Analyser & Ask Procurement Portal: Transforming Contract Review for Modern Enterprises

Mode_Comment_Icon_black0
Alarm_Icon_117 min

Procurement teams today are under pressure to move faster, reduce risk, and operate with greater transparency. Yet contract review — one of the most critical procurement responsibilities — remains slow, manual, and highly inconsistent across most organisations. 

A major enterprise client came to Octane facing exactly this challenge. Their procurement function was overwhelmed: contracts were buried in inboxes, reviews took hours, and comparing updated versions created delays and negotiation blind spots. 

Octane delivered a powerful, AI-enabled solution using IBM WatsonX Orchestrate — combining a Contract Analyser with an intelligent Ask Procurement interface. Together, these capabilities have redefined how the client manages contract intake, review, insights, and procurement intelligence at scale. 

Blog by Alan

The Business Challenge 

The client’s procurement team was experiencing significant bottlenecks: 

  1. Contract overload and inbox chaos

    Supplier agreements arrived via email and were often lost or delayed, slowing downstream purchasing decisions.  

  2. Time-consuming manual analysis

    Procurement staff could spend 1–3 hours per contract summarising content, identifying risks, and preparing commentary for stakeholders.

  3. Difficulty comparing contract versions

    Updated supplier contracts required line-by-line manual comparison, often leading to missed red flags and weaker negotiation leverage. 

  4. Limited visibility into procurement insights

    Leaders had no quick way to query procurement data, trends, supplier risks, or anomalies.

    These issues created avoidable risk, slowed procurement cycles, and stretched team capacity. 

The Octane Solution: AI-Enabled Contract Analyser + Ask Procurement 

Octane deployed a streamlined, automated solution powered by IBM WatsonX Orchestrate that addresses both contract processing and procurement intelligence. 

 AI Contract Analyser 

The analyser automatically: 

  • Captures new supplier contracts the moment they appear in email 

  • Extracts and understands contract text 

  • Summarises key clauses and obligations 

  • Identifies risks, red flags, and missing components 

  • Highlights differences between contract versions 

  • Generates a negotiation playbook 

  • Delivers insights to stakeholders instantly 

This means procurement teams no longer read contracts line-by-line — the AI does the heavy lifting. 

 Ask Procurement: AI interface for procurement intelligence 

As part of the deliverable, Octane introduced Ask Procurement, a conversational AI interface that allows users to: 

  • Query procurement data 

  • Identify spend trends 

  • Detect anomalies in contracts or vendors 

  • Access historical contract insights 

  • Surface negotiation patterns 

  • Review supplier performance indicators 

Whether it’s “Show me all suppliers with auto-renewal clauses” or “Summarise risk trends for our top five vendors,” Ask Procurement provides instant answers. 

Together, these tools create a true digital procurement co-pilot. 

The Impact for the Client 

The benefits have been significant and immediate: 

  1. Review time reduced to under a minute

    What previously took hours now happens automatically — contracts are analysed, summarised, and compared in seconds. 

  1. Reduced legal and commercial risk

    The AI produces a structured risk register, helping teams spot issues earlier and make more informed decisions. 

  1. Stronger negotiation positions

The system highlights: 

  • What changed between versions 

  • Why it matters 

  • Recommended negotiation arguments 

This gives the procurement team a consistent, data-driven advantage. 

  1. Faster procurement cycle times

    Automated intake and instant insights have removed bottlenecks, improving: 

  • Supplier onboarding 
  • Purchase approvals 
  • Contract turnaround times 
  1. No more lost contracts

    The AI automatically captures, stores, and processes every attachment. 

  1. Improved organisational intelligence

With Ask Procurement, leaders now have: 

  • Instant visibility 

  • Searchable procurement knowledge 

  • On-demand insights 

  • Clear trend analysis 

This shifts procurement from reactive to proactive. 

Why This Matters 

This project demonstrates what applied enterprise AI looks like in the real world — practical, operational, and immediately beneficial. 

It shows how organisations can: 

  • Modernise procurement without replacing systems 

  • Automate high-effort tasks with intelligent workflows 

  • Strengthen compliance and governance 

  • Provide teams with insights previously locked away in documents 

  • Use AI as an everyday digital procurement analyst 

It also reinforces that AI is not only for futuristic use cases — it is delivering meaningful value today. 

What’s Next: Full Lifecycle Automation with E-Signature 

The next extension is already underway: 
AI-driven e-signature workflows, enabling: 

  • Automated signing 

  • Routing and approval 

  • Audit trails 

  • Archiving and version control 

This will close the loop across the entire procurement lifecycle: 
Intake → Review → Insights → Decision → Signature → Storage 

Conclusion 

Octane’s AI Contract Analyser and Ask Procurement portal offer a new way forward for procurement teams looking to accelerate productivity, reduce risk, and enhance decision-making. 

By combining IBM WatsonX Orchestrate, structured AI reasoning, and deep procurement expertise, Octane has delivered a real-world, production-ready solution that transforms how contracts — and procurement intelligence — are managed at scale. 

If you'd like to explore how this could work inside your organisation, the Octane team is ready to demonstrate what’s possible. 

Line

Transform Enterprise Performance with IBM Analytics and AI Solutions

Mode_Comment_Icon_black0
Alarm_Icon_19 min

In today’s volatile business landscape, agility is no longer a competitive advantage—it’s a necessity. True agility means moving beyond fast response to actively anticipating market shifts and seamlessly aligning people, processes, and technology to act decisively. 

From Insight to Impact (1)

Enterprises possess vast troves of data, yet the ultimate differentiator is the ability to transform that data into actionable insights and automated, intelligent decisions. At Octane Analytics, we are driving this transformation across industries by evolving disconnected reporting tools into a unified, intelligent ecosystem powered by IBM's premier analytics and AI platforms. 

The Unified Framework for Intelligent Decisions 

IBM’s comprehensive suite of solutions—including Planning Analytics, Cognos Analytics, SPSS, Decision Optimisation, Controller, and Watsonx Orchestrate—delivers a connected framework that manages business performance from strategic vision through to operational execution. This integration establishes a data-to-decision continuum where insights fluidly integrate into planning, execution, and automation cycles. 

  • IBM Planning Analytics moves organisations beyond static budgeting to dynamic, driver-based forecasting and scenario modelling. 
  • IBM Cognos Analytics empowers business users with AI-driven dashboards and visualisation tools for deep insight exploration. 
  • IBM SPSS integrates statistical precision and data science into business planning, ensuring predictions are rooted in reliable data, not intuition. 
  • IBM Decision Optimisation models complex business scenarios to identify the most efficient and optimal outcomes. 
  • IBM Controller simplifies and automates financial consolidation, closing, and regulatory reporting. 
  • IBM Watsonx Orchestrate enables non-developers to automate repetitive workflows, directly connecting insights to business action without writing code. 

The Pivot to Predictive and Prescriptive Analytics 

Many organisations remain reactive, focused on analysing "what happened." The step-change in performance occurs when analytics shift to answering the crucial questions: “what will happen?” (Predictive) and “what should we do about it?” (Prescriptive). 

The integrated IBM ecosystem facilitates this critical shift: 

  1. Prediction Informs Strategy: Predictive models built in SPSS directly inform forecasts within Planning Analytics, making financial and operational plans immediately responsive to market shifts. 

  2. Prescription Optimises Action: Decision Optimisation identifies the best sequence of actions to achieve a business goal, operating within specified constraints. 

  3. Automation Operationalises Insight: Watsonx Orchestrate then automates the prescribed follow-up actions—whether triggering workflows in HR, Finance, or Operations—significantly boosting responsiveness and reducing manual workload


This synergy elevates the organisation from merely data-driven to decision-driven, where insights are not just observed but fully operationalised. 

AI and Automation: Transforming Finance and Operations 

Automation is no longer confined to the IT department. Today, modern CFOs, HR executives, and department leaders are leveraging agentic AI to offload repetitive, high-volume tasks and achieve new levels of efficiency. 

Consider the impact across key functions: 

  • Financial Performance Management: Imagine a Finance Manager who automatically receives consolidated reports prepared by the IBM Controller, reviewed with AI-assisted insights from Cognos Analytics, and validated against dynamic budget forecasts from Planning Analytics. 
  • Intelligent HR Operations: A People Leader uses Watsonx Orchestrate to streamline repetitive HR tasks—from scheduling interviews and summarising resumes to ensuring records are instantly updated across all ERP systems.

At Octane Analytics, we specialise in designing and deploying these agentic AI ecosystems, ensuring automation amplifies human capability and drives measurable outcomes.  

Why Choose Octane Analytics? 

As an IBM Gold Partner, Octane Analytics offers deep, specialised expertise in integrating and optimising IBM’s entire performance management stack. 

Our approach is centred not just on product deployment, but on measurable business outcomes: enhanced agility in planning, increased accuracy in forecasting, greater efficiency in reporting, and empowerment through automation. 

Whether your immediate need is strategic financial consolidation or a full-scale enterprise performance management overhaul, our team provides the expertise to define the roadmap, deliver the integrated solution, and ensure a demonstrable Return on Investment (ROI). 

The Future: A Connected, AI-Powered Enterprise 

The future of enterprise performance hinges on connected intelligence—an environment where AI and analytics continuously learn, adapt, and act across all business functions. 

Organisations that master this integrated, AI-first approach will not only achieve operational efficiency but also build unparalleled resilience and foresight in a rapidly changing global market. At Octane Analytics, we are committed to helping enterprises realise this future, one intelligent decision at a time. 

Let’s Build the Intelligent Enterprise Together 

If you are exploring how integrated AI, advanced analytics, and automation can significantly elevate your business performance, we invite you to connect with us. Our team can provide tailored, real-world use case demonstrations—from predictive planning to automated workflow execution—all powered by IBM’s market-leading technology. 

📩 Reach out to Octane Analytics today to schedule a discovery session. 

Line

The CFO's AI Playbook : From Ah-Ha to Acceleration

Mode_Comment_Icon_black0
Alarm_Icon_126 min


We are standing at the threshold of the most significant transformation in finance since the invention of the spreadsheet. Artificial Intelligence isn’t a future concept — it’s here — quietly rewriting how finance teams plan, decide, and perform. 

And yet, despite the global AI boom, 95% of enterprise AI initiatives fail to deliver measurable impact. Not because the technology falls short, but because most organisations stop too soon. They automate tasks but never redesign the system. 

At Octane Solutions, we’ve worked with over 100 finance teams across APAC — and we’ve seen what separates the few that scale from the many that stall. The secret is simple but profound: structure before scale. 

From Industrial Revolution to Intelligent Finance 

preencoded.pngText 4, Textbox

When electricity first arrived in the 19th century, factories did what seemed logical — they replaced gas lamps with electric bulbs. Workplaces became brighter and safer, but not smarter. The true revolution began when they redesigned entire production lines around electric motors, unleashing a new era of efficiency and innovation. 

Finance today stands at a similar crossroads. 

Chatbots, copilots, and summarisation apps are our lightbulbs — illuminating the potential of AI but not transforming how work gets done. The real breakthrough will come with Agentic AI — a new generation of intelligent systems that reason, coordinate, and act autonomously across the finance ecosystem. 

Agentic AI doesn’t just automate; it orchestrates. It doesn’t replace people; it amplifies them. And for the CFO, that means the finance function can finally shift from explaining the past to predicting — and shaping — the future. 

The CFO’s Challenge: Insight at the Speed of Business

CFOs today face a dual reality: 

  • The demand for immediacy: real-time forecasting, continuous scenario analysis, and rolling insights. 
  • The constraint of legacy: manual reconciliations, fragmented data, and static planning cycles. 

Most finance teams have automated fragments of their process — but not the process itself. Reporting is faster, but not necessarily smarter. True transformation happens only when AI becomes part of the fabric of finance — not an add-on. 

Below are 6 opportunities now emerging as AI evolves from simple LLMs to self-governing, multi-agent ecosystems: 

  • Conversational analytics and natural-language access to financial data. Finance teams can now ask a question — “What’s our EBITDA variance this quarter?” — and receive a fully contextualised, narrative answer drawn from live systems.
    By eliminating manual report preparation, CFOs gain faster clarity and sharper storytelling for stakeholders.
    Impact: 80% reduction in analyst report-prep time and faster decision support across FP&A. 
  • AI that reads, reconciles, and extracts insight from financial documents, PDFs, and spreadsheets.
    An airline company uses AI agents linked to Planning Analytics and Excel sources to generate reconciled financial reports in 10 minutes instead of two weeks.
    Impact: Continuous visibility into financial performance, replacing static monthly reporting with real-time oversight. 
  • AI with direct access to corporate databases, enabling dynamic analysis. For a Media company, Octane’s “AskFinance” agent combined data from TM1, Adobe Analytics, and Google Ad Manager to generate contextual financial commentary in seconds.
    Impact: 80% reduction in report-generation cost and 98% faster access to narrative insights — AI that doesn’t just calculate but explains why. 
  • AI that integrates across finance platforms — TM1, SAP, Concur, ERP, and APIs — to coordinate entire workflows. Through Watsonx Orchestrate, CFOs can now automate the entire chain from forecasting to variance reporting:  “Generate a cashflow forecast and alert me if OPEX exceeds budget by 5%.” AI handles retrieval, validation, and communication autonomously.
    Impact: 99% reduction in manual reporting cycles; faster consolidation, real-time alerts, and seamless cross-system collaboration. 
  • Autonomous decision-making within governed boundaries.  AI agents now detect anomalies, recommend journal adjustments, and monitor exceptions before they escalate. This allows finance functions to move from reactive close cycles to proactive exception management.
    Impact: Predictive close cycles, risk reduction, and up to 60% ROI in the first 12 months of deployment. 
  • Safe, transparent, multi-agent ecosystems that manage entire finance functions. Each agent — whether a “forecast bot,” “audit bot,” or “reporting bot” — operates under strict governance, with auditability, explainability, and regulatory alignment. Octane’s enterprise rollout playbook embeds SOC2, GDPR, and financial reporting controls into every workflow.  
    Impact: Full audit traceability, regulator-ready documentation, and scalable, trusted AI adoption. 

The CFO’s now need to realise that their goal is no longer to add another digital assistant, but to build an ecosystem of intelligent, responsible, and explainable agents that make finance self-improving. This shift isn’t about hype or replacing people. It’s about constructing a resilient, data-driven finance engine that learns, adapts, and optimises continuously — from planning to forecasting to audit. 

Agentic AI marks the true turning point of the finance— moving beyond automation to orchestration, where decisions are made faster, risks are mitigated earlier, and value is created intelligently. 

The 9 Principles Behind Successful AI Transformation 

Through 100+ modernisation projects, Octane has distilled nine practices that consistently deliver value:

1.  Align AI to Business Impact – Focus on measurable outcomes, not pilots. 

2. Build a Finance AI Centre of Excellence – Unite Finance, IT, and Operations under a single vision. 

3. Invest in Skills, Not Just Software – Equip people to interpret, question, and guide AI.  

4. Adopt Adaptive Governance – Control risk without stifling innovation. 

5. Prioritise Data Quality – No AI can outperform bad data. 

6. Start with Use Cases – Identify problems before choosing platforms. 

7. Automate the Mundane – Free people for creative and strategic work. 

8. Measure by Business Outcomes – Look beyond cost savings to agility, accuracy, and trust. 

9. Scale Proven Success – Replicate what works across divisions. 

Transformation begins with clarity, not complexity. 

The Foundation of Trust and Scale: IBM 

AI’s potential means nothing without trust. That’s why Octane’s partnership with IBM is central to every finance transformation journey. 

Built on IBM’s Agentic AI Platform this foundation ensures that CFOs can modernise with confidence — embedding explainability, governance, and measurable ROI from day one. IBM’s Watsonx Orchestrate (Agentic AI Platform) is a key enabler. It uses intelligent digital workers to automate complex workflows, from reconciliations to board-pack creation. With embedded governance, it’s designed to keep humans in control while machines handle the heavy lifting. 

Explore: IBM Watsonx Orchestrate → 

Agentic AI: From Automation to Orchestration 

IBM’s Agentic AI Frameworks mark a shift from tools to systems — from automating tasks to orchestrating end-to-end business outcomes. 

They include: 

  • Agent Development Lifecycle (ADLC): The governance backbone for building responsible agents. 

  • Model Context Protocol (MCP): A transparent standard for open, explainable AI. 

  • Hybrid-First Architecture: Ensures flexibility across cloud, on-prem, and edge. 

This architecture doesn’t just make AI smarter — it makes it sustainable. 

Learn more: Agentic AI Frameworks → 

Anthropic + IBM: Responsible AI for Regulated Finance 

IBM’s partnership with Anthropic brings the Claude family of models into the Watsonx ecosystem — marrying safety and sophistication. 

This enables CFOs to deploy AI assistants that: 

  • Generate narrative financial reports in natural language. 
  • Automate forecasting and scenario modelling. 
  • Support reconciliations and anomaly detection within governed environments. 

It’s AI that works like a trusted analyst — intelligent, auditable, and always under your control. 

Read more: IBM–Anthropic Partnership → 

Groq + IBM: Redefining Speed and Efficiency 

AI adoption often stalls on cost and latency. Groq changes that. 

By integrating Groq’s high-speed LPU architecture into Watsonx Orchestrate, IBM delivers 5× faster inference and 80% lower compute cost — without compromising security. 

This is the infrastructure that turns AI pilots into production systems. 

Octane + IBM: The Partnership That Delivers 

Octane’s partnership with IBM isn’t symbolic — it’s operational. Our IBM Champions work hand-in-hand with IBM’s product and engineering teams to co-create real-world use cases for finance. 

From FP&A to supply chain modelling, Octane helps clients deploy AI-ready cubes, design agentic workflows, and establish continuous improvement frameworks that evolve with business needs. 

Our Global support models — Octane Black and Octane Blue — offer CFOs flexible, SLA-backed coverage that reduces total cost of ownership by up to 35%. 

AI success isn’t about pilots — it’s about discipline, design, and delivery. 

summary, The Cognitive Finance Function- The finance team of the future will not just report performance — it will anticipate, optimise, and advise. 
It will be: 

  • Predictive, not reactive. 
  • Autonomous, not manual. 
  • Augmented, not overloaded. 
  • Connected, not siloed. 
  • Trusted, not opaque. 

This is The Cognitive Finance Function — powered by AI, governed by design, and aligned with enterprise strategy. 

What Next?  

AI in finance isn’t about technology — it’s about transformation. The winners will be those who move beyond experiments to execution, designing their finance operations for intelligence, not just automation. As we head towards 2026, it's vital that your finance strategic plans are set and able to be easily communicated for impact. 
 
Octane and IBM are helping CFOs make that leap — securely, measurably, and fast.  


Book a strategy session with Octane to explore your AI-in-Finance roadmap and we’ll walk you through the below practical Roadmap to Building an Intelligent Finance Function 

A qr code with blue squares
AI-generated content may be incorrect.


Start a free trial  

Sign up for a 30-day free 


Diagnose — Identify Where AI Can Create Meaningful Impact 

Design — Combine Orchestration with Human Judgment 

Deploy — Start Small, Prove Fast, Scale Wisely 

Demonstrate — Quantify ROI and Institutionalise Learnings 

Differentiate — Make Finance the Intelligent Core of the Enterprise 

Final Thought: From Lightbulb to Lighthouse 

The future of finance belongs to leaders who don’t just turn on AI — they design for it.  CFOs who embed intelligence, governance, and agility into their finance DNA will redefine how value is created and measured 


Line

IBM Satellite Connector: Bridging the Gap Between Edge and Cloud

Mode_Comment_Icon_black0
Alarm_Icon_16 min

In the modern era of cloud computing, businesses are increasingly leveraging distributed architectures to meet the growing demand for faster, more efficient services. One of the key innovations that addresses this need is the concept of edge computing, where data processing occurs closer to the source of the data rather than relying on centralised cloud data centres. However, with the edge computing paradigm comes the challenge of connecting devices and systems distributed over a wide area and ensuring smooth communication between edge environments and the cloud. IBM’s Satellite Connector is designed to solve this problem by offering a seamless and secure way to integrate edge workloads with cloud services.

What is IBM Satellite Connector? 

The IBM Satellite Connector is a robust solution that allows businesses to extend their IBM Cloud environment to the edge of their networks. It is part of IBM’s suite of solutions for edge computing and hybrid cloud environments, allowing organisations to run cloud-native applications and workloads closer to data sources, such as IoT devices or remote locations, while maintaining connectivity with IBM Cloud. 

The Satellite Connector enables the connection between edge environments (often referred to as "satellites") and IBM’s central cloud infrastructure. It facilitates real-time data synchronisation, secure communication, and application deployment at the edge. This reduces latency, improves system responsiveness, and helps ensure that businesses can operate in a more decentralised and efficient manner. 

Code Engine components 

Mainly, the script provisions three different components, representing the different types of workloads that IBM Cloud Code Engine supports today.

  • Function - ideal for short running use cases that require low latency - acts as the HTTP proxy for the payload provided by the NGINX server
  • Job - ideal for long-running, run-to-completion tasks that require a lot of resources for some time - connects to the PostgreSQL database and inserts a record per submitted instance  
  • App - the swiss knife, which is ideal for all sorts of HTTP server use cases that need to scale efficiently - connects to the PostgreSQL database to query stored data and provide it as a JSON payload on an HTTP endpoint 

Key Features of IBM Satellite Connector 

  1. Seamless Integration with IBM Cloud: The Satellite Connector extends IBM Cloud services to remote locations by creating a hybrid cloud environment. This integration ensures that workloads can be run and managed both on the cloud and at the edge without disruptions or data silos.

  2. Low Latency: One of the key benefits of edge computing is the reduction in latency. By processing data closer to the source, IBM Satellite Connector ensures that real-time insights are available without relying on the often slow transmission speeds of cloud-based processing.

  3. Scalability: The Satellite Connector is designed to scale with the needs of your business. Whether you are managing a small set of edge devices or hundreds of remote systems, IBM’s solution can handle a diverse range of deployments. This scalability allows businesses to grow without the need for costly infrastructure changes.

  4. Security and Compliance: IBM places a strong emphasis on security, and the Satellite Connector is no exception. The solution ensures encrypted communication between cloud environments and edge devices. It also supports compliance with industry-specific regulations, allowing businesses to maintain security standards and protect sensitive data across both edge and cloud systems.

  5. Offline Operation: One of the standout features of the Satellite Connector is its ability to maintain functionality even when the edge device is temporarily disconnected from the central cloud. This feature is critical in remote or mobile environments where continuous connectivity is not guaranteed. Data and workloads are stored and processed locally, and once connectivity is restored, data synchronisation takes place automatically.

  6. Edge Analytics: IBM Satellite Connector allows businesses to perform analytics at the edge. This means that large volumes of data generated by IoT devices, sensors, or other systems can be processed in real-time, reducing the need for data to be sent to the cloud for analysis. By processing data at the edge, organisations can derive faster insights and make quicker decisions.

  7. Simplified Deployment: The Satellite Connector simplifies the deployment of edge workloads by leveraging containerization technology. IBM uses Red Hat OpenShift to orchestrate and manage the containers across cloud and edge environments. This ensures that developers can seamlessly build and deploy applications on both the cloud and at the edge, all from a unified platform. 

Use Cases for IBM Satellite Connector

IBM Satellite Connector is highly versatile and can be used across a variety of industries and applications, including:

  • Industrial IoT (IIoT): In manufacturing environments, IoT devices generate massive amounts of data. IBM Satellite Connector enables real-time data processing on the factory floor, making it easier to monitor equipment performance, detect faults, and take corrective actions promptly.

  • Smart Cities: Cities are adopting IoT sensors to improve services such as traffic management, waste management, and public safety. IBM Satellite Connector helps to process and analyse the data from these sensors locally, ensuring a quick response to changing conditions while also transmitting relevant data to cloud-based systems for further analysis.

  • Healthcare: In healthcare, medical devices often need to operate in real-time and with minimal latency. IBM Satellite Connector ensures that critical health data can be processed and analysed at the edge, improving the speed and quality of care, while still ensuring that patient data is securely stored and transferred to cloud systems.

  • Retail: Retailers use edge computing for applications such as customer behaviour analytics, inventory management, and personalised services. IBM Satellite Connector allows data from IoT devices in retail locations to be processed locally, enhancing the customer experience while maintaining synchronisation with central cloud systems for business insights.

  • Autonomous Vehicles: In the case of autonomous vehicles, edge computing plays a critical role in processing data from various sensors and making decisions in real-time. IBM Satellite Connector facilitates secure communication between the vehicle’s edge computing system and central cloud resources, ensuring real-time operational intelligence. 

Benefits of Using IBM Satellite Connector

  • Improved Efficiency: By processing data closer to where it is generated, businesses can achieve faster decision-making and reduce the burden on central cloud resources. This leads to enhanced operational efficiency and reduced latency.

  • Reduced Costs: IBM Satellite Connector allows businesses to optimize their infrastructure by offloading processing tasks to the edge. This reduces the need for significant investments in cloud-based computing resources and network bandwidth, helping to lower overall costs.

  • Increased Resilience: With offline capabilities and the ability to operate independently of cloud connections, IBM Satellite Connector increases system resilience. This is particularly valuable in remote or challenging environments where network connectivity may be unreliable.

  • Future-Proofing: As businesses continue to adopt more IoT devices and edge technologies, IBM Satellite Connector helps ensure that their cloud and edge environments remain scalable and adaptable. It supports the growing demands of edge computing while keeping businesses connected to their central cloud services. 

In today’s fast-paced digital landscape, where data is generated at the edge and needs to be processed in real-time, the IBM Satellite Connector offers a reliable, secure, and scalable solution to extend the power of the cloud to edge devices. By enabling seamless communication between cloud services and distributed edge environments, it allows businesses to harness the full potential of edge computing while maintaining the benefits of cloud-based infrastructure. Whether it's in manufacturing, healthcare, retail, or any other industry, IBM Satellite Connector is an essential tool for businesses looking to improve efficiency, scalability, and innovation in their operations. 

The future of computing lies at the edge, and with the IBM Satellite Connector, businesses are ready to meet that future head-on. 

Line

Transforming Finance with Generative AI

Mode_Comment_Icon_black0
Alarm_Icon_13 min

In a recent project with a leading media company in Australia, we set out to demonstrate how IBM Watsonx Orchestrate can revolutionise finance operations through the power of Generative AI. The Commercial Finance team, under constant pressure to deliver timely, accurate and insight-rich reports, needed a smarter way to move beyond manual data wrangling and deliver executive-ready outputs in record time. 
 Alan blog (1)

That’s where WatsonX Orchestrate came in. Unlike traditional BI or workflow automation tools, Watsonx Orchestrate leverages Generative AI to not only automate repetitive tasks but also to interpret, contextualise and generate meaningful outputs. The result is a system that empowers both analysts and executives to act faster, with confidence, while minimising human bottlenecks. 

Automating Financial Report Generation

Key Capabilities:

  • Automated extraction, transformation and loading (ETL) of data from a data warehouse.

  • Automated generation of third-party and monthly executive summary reports.

  • AI-driven identification of key events influencing financial outcomes.

  • Analyst verification loop to ensure accuracy and compliance. 

Business Impact:

  • Reports created in minutes rather than weeks.

  • Reduced data duplication and inconsistencies.

  • Analysts free to focus on high-value strategic analysis.

  • Executives receive timely, validated insights for faster decision-making. 

Self-Service Financial Insights

Key Capabilities:

  • A bespoke AskFinance portal enabling natural language queries.

  • Secure access aligned with role-based permissions.

  • Pre-trained CFO scenarios to simulate executive decision contexts.

  • Integrated visualization tools for interactive reporting. 

Business Impact:

  • Executives gain independence in accessing financial data.

  • Real-time insights without reliance on BI analysts.

  • Streamlined reporting across departments and report types.

  • Forecasting and scenario modeling made simple, accurate and quick. 

Use Cases in Action

Producing Monthly YTD Monetisation Reports: Automating the calculations behind key metrics, seamless PowerPoint slide generation, clean, consistent reporting outputs in a standardised format. 

Delivering Monetisation Insights: Automated chart creation and AI-driven callouts, generative commentary highlighting anomalies or areas needing attention, a natural language interface to query insights and commentary directly. 

Tangible Benefits

  • ~60% ROI: Analysts reallocated to higher-value activities, reducing attrition costs.

  • ~99% efficiency gains: Manual reporting reduced to near-zero.

  • 2 weeks → 10 minutes: End-to-end report creation compressed dramatically.

  • Improved data quality: Automated reconciliation reduces inconsistencies and errors.

  • Scalability: Built to handle larger datasets and evolving financial needs. 

Beyond Media: Industry Relevance

The use case resonates strongly across industries, such as airlines, where BI Analysts and Finance teams spend significant time manually preparing and reconciling data. In one example, reliance on IBM Planning Analytics was slowing executive decision-making as stakeholders had to wait for analysts to deliver real-time data insights. 
 
Watsonx Orchestrate bridges this gap by delivering: 
Automation of complex financial workflows. 
Generative insights at scale. 
Democratisation of access to financial intelligence. 

Curious how Agentic AI could reshape your finance operations? Let’s start a conversation tailored to your requirements. 


Line

8 Forces Reshaping the Future of Finance

Mode_Comment_Icon_black0
Alarm_Icon_117 min

The 8 Forces Reshaping the Future of Finance – and How Agentic AI Helps CFOs Lead

Gartner has pin pointed 8 disruptive forces set to fundamentally transform the finance function. These changes—spanning technological advancements, organisational shifts, and regulatory upheavals- pose both risks and opportunities for CFOs. Success will belong to those who leverage Agentic AI, such as WatsonX Orchestrate, and Extended Planning & Analytics, like IBM Planning Analytics, to not merely adapt but to lead the transformation. Finance is standing at a critical juncture. Gartner emphasises that the role of finance is evolving from historical reporting to actively shaping the future of the business.

To lead in this new landscape, CFOs require more than automation. They need Agentic AI, like IBM Watsonx Orchestrate, to operate seamlessly across workflows and Extended Planning & Analysis (xP&A), such as IBM Planning Analytics, to serve as a unified, intelligent source for forecasting, scenario planning, and decision-making. 

Together, these platforms form a new operational foundation for finance, striking a balance between cost efficiency, agility, governance, and innovation.  

1. A Workforce of AI Agents 

The Challenge: By 2027, one-third of enterprise software will embed Agentic AI. Finance tasks once performed manually will be supervised and executed by autonomous agents, driving exponential efficiency. 

The Solution: 

  • Watsonx Orchestrate deploys AI agents that autonomously reconcile data, build “what-if” scenarios, or flag exceptions across ERP, CRM, and finance platforms. 

  • These agents don’t just predict outcomes; they act — re-routing approvals, generating reports, and escalating high-value tasks.

The Outcome: Finance staff move beyond low-value reconciliation and report prep, shifting their time to strategy, storytelling, and insight creation. 

2. Machine-Dominated Decision Making 

The Challenge: By 2028, 70% of finance functions will rely on AI-powered real-time decisioning. Human-led bottlenecks will give way to AI-enhanced scenario modelling and automated choices.

The Solution: 

  • Planning Analytics creates driver-based models that focus on variables that truly move the business (e.g., unit margins, demand drivers, or tariff costs). 

  • Watsonx Orchestrate translates these models into actions, running multiple scenarios in parallel and surfacing recommendations with governance and audit trails. 

The Outcome: CFOs can make confident decisions faster — automating routine trade-offs while freeing analysts to stress-test strategy. 

3. Rise of Do-It-Yourself Tech 

The Challenge: Low-code and no-code platforms will see $41B in spend by 2028, enabling finance to become digitally self-sufficient. 

The Solution:

  • Planning Analytics provides a governed sandbox for FP&A teams to run ad-hoc models, ensuring agility without fragmenting data integrity. 

  • Watsonx Orchestrate acts as the connective tissue, pulling insights into workflows and presenting results conversationally. 

The Outcome: True finance self-sufficiency — teams empowered to experiment and run scenarios, without losing enterprise-wide consistency. 

4. The End of Transactional Customisation 

The Challenge: By 2030, most finance functions will converge on identical transactional processes. Differentiation will come from insights and agility, not customisation. 

The Solution: 

  • Watsonx Orchestrate automates repetitive, non-differentiating processes (invoice matching, close cycles, reconciliations). 

  • Planning Analytics ensures finance value lies in insight and foresight, not transactions — embedding real-time planning across the enterprise. 

The Outcome Finance becomes a growth engine, not a cost centre, investing resources in innovation and transformation rather than maintenance. 

5. The Lonely Enterprise 

The Challenge: Self-service tech adoption (20–50% penetration in 2 years) will push analysis out of finance and into the business. 

 The Solution: 

  • Planning Analytics creates a living model of assumptions, policies, and KPIs.

  • Watsonx Orchestrate enables agents to auto-generate compliance reports, simulate regulatory impacts, and escalate issues proactively. 

The Outcome: CFOs can stay ahead of regulators, ensuring confidence in disclosures and agility in response, without ballooning compliance costs.

6. Maximally Matrixed Organisations 

The Challenge: By 2030, large enterprises will become increasingly matrixed — characterised by complex reporting lines, distributed decision-making, and cross-functional dependencies. While this model allows global scale, it comes at a cost: decision-making slows down, bottlenecks multiply, and finance often becomes the bottleneck rather than the enabler. Gartner predicts a significant reduction in corporate decision speed due to this complexity. 

How CFOs Stay Agile with IBM

  • Watsonx Orchestrate cuts across silos by deploying AI agents that integrate data from disparate systems (ERP, CRM, HR, supply chain). These agents autonomously synthesise inputs, flag bottlenecks, and propose actions without waiting for endless email chains or manual escalations.

  • Planning Analytics provides a single source of truth across geographies and business units, enabling finance teams to run real-time, driver-based scenarios that reflect the complexities of a matrixed structure.

The Outcome: CFOs regain speed and agility. Instead of being trapped in the complexity of governance and approvals, decisions are powered by cross-system insights, actionable in minutes rather than weeks. Finance evolves into the “accelerator” in a maximally matrixed enterprise.

7. The Finance Talent Crash

The Challenge: The finance profession is heading toward a talent crunch. Demand for digital, analytical, and AI skills is skyrocketing, but the supply of finance professionals with this hybrid capability is scarce. Meanwhile, much of finance talent remains locked in repetitive tasks like reconciliations, reporting, and compliance — jobs that do little to attract or retain the next generation. 

How IBM & Octane Mitigate the Crash

  • Agentic AI (Watsonx Orchestrate) automates routine, manual workflows such as reconciliations, reporting prep, and document processing. By doing so, it frees scarce talent to focus on strategic work: forecasting, scenario planning, and advising the business.

  • Planning Analytics amplifies finance professionals’ value by equipping them with tools to run advanced models, predictive forecasts, and multi-scenario analysis.

  • Octane’s AI Adoption Workshops (delivered in partnership with IBM) provide hands-on reskilling for FP&A teams. These workshops ensure finance professionals transition from “spreadsheet operators” to strategic analysts who understand both the business and the AI tools that power it. 

The Outcome: CFOs can do more with less. Talent is not just retained but re-energised, focused on high-value activities that align with business growth. The talent gap becomes an opportunity: finance professionals become champions of digital transformation rather than casualties of automation.

8. The Era of Discontinuous Regulatory Change

The Challenge: Regulatory landscapes are evolving faster than ever. From ESG disclosures to cross-border tax regimes and industry-specific compliance requirements, CFOs face a constant barrage of discontinuous, unpredictable regulatory changes. Manual compliance frameworks can no longer keep pace, exposing firms to risk and spiralling costs of control. 

How Watsonx Orchestrate & Planning Analytics Support

  • Watsonx Orchestrate embeds governance and compliance into every workflow. AI agents automatically generate audit trails, monitor transactions for anomalies, and escalate risks before they become issues. Instead of building compliance after the fact, governance becomes native and continuous.

  • Planning Analytics enables finance to run regulatory impact scenarios in real time — modeling, for example, how a new ESG disclosure requirement might affect capital allocation or how new tax rules impact profitability by geography.

  • Combined, they give CFOs the ability to adapt instantly, ensuring compliance while keeping costs under control. 

The Outcome: Regulatory change becomes less of a disruption and more of a strategic advantage. CFOs can demonstrate resilience to boards and regulators, protecting reputation while ensuring agility. 

Adaptive Scenario Planning: Why This Matters Now

The real battleground for CFOs is scenario planning. Traditional methods are too slow for today’s volatility. Adaptive approaches — powered by AI — allow finance leaders to: 

  • Run rolling forecasts updated daily, not quarterly.

  • Build driver-based models that respond instantly to tariffs, FX rates, or demand shocks.

  • Generate multiple scenarios in real time and attach clear contingency playbooks.

  • Show investors not just one “answer,” but a strategic range of preparedness.

Here’s where the synergy between Planning Analytics and Watsonx Orchestrate is critical:

  • Planning Analytics ensures the data model, drivers, and assumptions are clean, integrated, and ready for real-time updates.

  • Watsonx Orchestrate enables CFOs to simply ask, “How does a 5% tariff change impact margin by region?” and instantly receive scenario outputs — plus trigger next steps (e.g., adjust budgets, reschedule supplier contracts). 

The CFO’s Leadership Imperative 

The forces reshaping finance — from matrixed complexity to talent shortages to regulatory turbulence — are daunting. But they also present a unique opportunity. CFOs who embrace Agentic AI today won’t just adapt to disruption; they’ll lead it. 

With IBM Watsonx Orchestrate (Agentic AI) and IBM Planning Analytics (xP&A), the Office of Finance can: 

  • Automate: Cut month-end close cycles by 3× while reducing manual errors.

  • Anticipate: Run real-time “what-if” scenarios with confidence, powered by driver-based models.

  • Adapt: Stay compliant amid discontinuous regulatory change with embedded audit trails and anomaly detection.

  • Amplify: Re-deploy scarce finance talent into strategic, growth-focused roles. 

The message is clear: The 8 forces will reshape finance — but with Agentic AI, CFOs can lead the disruption, not be disrupted. 

The Payoff: Efficiency Meets Innovation

When finance leaders integrate these technologies, the results are dramatic:

  • 99% faster reporting – weeks of manual effort compressed into minutes.

  • 3× faster close cycles – freeing capacity for forward-looking analysis.

  • 60% ROI in Year One – cost savings plus strategic impact.

  • Cultural transformation – finance staff moving from routine tasks to high-value thinking: experimentation, scenario testing, and strategic advising. 

Why Partner with Octane

Transformation isn’t just about technology; it’s about execution. That’s where Octane makes the difference, you’ll hear how leaders from IBM, Rinnai Australia, and Octane are already using AI to unlock efficiency, cut manual reporting by 40+ hours a week, and even accelerate M&A integration. Watch the recording: 

  • AI Adoption Workshops: Delivered in partnership with IBM, Octane’s workshops provide hands-on reskilling for FP&A teams. These ensure finance professionals transition from “spreadsheet operators” to strategic analysts who understand both the business and the AI tools that power it.
  • Fixed-Price Upgrade Offer: Octane can modernise your xP&A platform on a fixed-price basis after just a 2-hour technical workshop with your team.
  • AI in Finance Use Cases: In parallel, after a 2-hour strategic workshop with your finance leadership, Octane will deliver two AI use cases tailored to your business — so you see tangible value in weeks, not months. 

CFOs are no longer just guardians of cost, they are champions of transformation.  

With Watsonx Orchestrate and Planning Analytics, powered by Octane’s delivery expertise, you can accelerate value in 6–8 weeks: modernise your platform, reskill your teams, and embed AI use cases that pay back immediately. 

Bring your own Use Case 

Bring to life your own use case that generates business value to your organisation with the help of our team of AI experts. 

 Talk to us!


Line

AI Revolution in Finance: Rinnai's 12-Month Transformation to AI-Ready

Mode_Comment_Icon_black0
Alarm_Icon_15 min

For years, finance leaders have debated when the time would come to embed Artificial Intelligence (AI) into their operations. That time is no longer in the future. AI has become a business imperative—a driver of efficiency, agility, and competitive advantage for CFOs under mounting pressure to deliver more with less.

Group 41

This is not just theory. It’s happening today. And Rinnai Australia is a standout example.

In just 12 months, Rinnai has modernised its finance platform, embedding IBM Planning Analytics (PA) with support from Octane Software Solutions. The result? A finance function that has freed up 40 hours per week of manual effort, cut reporting cycles from weeks to four days, reduced reliance on spreadsheets by 50%, improved staff morale, and positioned the business for AI-driven forecasting, predictive models, and even faster M&A integration.

This story, and what other CFOs can learn from it, will be at the centre of the upcoming CFO Lunchtime Live Webcast, hosted by CFO Magazine’s James Solomons, featuring Dilend Chawda (Rinnai Australia), Darksha Nadesewaran (IBM ANZ), and Amendra Pratap (Octane Software Solutions).

The Starting Point: Fragmented, Manual, and Complex

Like many growing businesses, Rinnai faced the challenge of fragmented finance processes. Over the years, the organisation had grown in complexity through multiple subsidiaries and M&A activity. Finance was juggling different tools—from Cognos and TM1 to Essbase and Oracle OACS—with high spreadsheet dependency for budgeting and reporting.

The result was:

  • Long reporting cycles: Subsidiaries took weeks to close, delaying group-level insights.

  • Spreadsheet chaos: Dozens of versions, late-night reconciliations, and version-control headaches.

  • 3-month budgeting cycles: A bottom-up approach involving countless files, links, and manual inputs.

  • Staff fatigue and low morale: Finance teams were bogged down in reconciliation and data wrangling rather than analysis.

The system simply wasn’t fit for a fast-moving organisation that needed real-time insights, scenario planning, and agility in the face of market volatility.

The Transformation Journey

1. Building a Modern Platform with IBM Planning Analytics

In mid-2024, Rinnai partnered with Octane SoftwarIn mid-2024, Rinnai partnered with Octane Software Solutions to modernise its finance platform with IBM Planning Analytics. Within weeks, the first modules were live:

  • August 2024: Group month-end reporting (P&L, Balance Sheet).

  • October 2024: Product profitability reporting—allocating operating profit down to individual products.

  • November 2024: Logistic demand planning—12-month SKU-level forecasting.

  • December 2024: Budget suite for 2025—integrated with sales, costing, workforce, capex, and manufacturing recovery cubes.

  • June 2025: Subsidiaries fully integrated—Xero trial balances from subsidiaries consolidated into group reporting.

This was a swift, phased deployment that made transformation tangible within months, not years.

2. Quantifiable Benefits Delivered

The outcomes have been both immediate and measurable:

  • 40 hours/week saved: Automation of data consolidation and reporting removed manual wrangling.

  • Reporting cycle cut to 4 days: Down from weeks for subsidiaries.

  • 50% fewer spreadsheets: Dramatically reducing version errors and reconciliation headaches.

  • Budgeting accelerated: From a painful 3-month cycle to a streamlined, collaborative process.

  • Staff morale uplift: Finance staff moved from data entry to analysis, improving job satisfaction and retention.

  • 10% targeted inventory reduction: Through AI-enabled demand planning, reduce warehouse costs while ensuring sales coverage.

The shift has not just been technical—it has been cultural. Finance is no longer the bottleneck, but the enabler.

3. AI Foundations and Next Steps

Rinnai’s transformation has built the foundation for AI adoption. Already, the company is:

  • Running predictive models for working capital management.

  • Leveraging IBM PA Assistant (built on watsonx) for natural language queries, commentary automation, and outlier analysis.

  • Piloting agentic AI assistants (Watson Orchestrate) to automate workflows.

  • Experimenting with generative AI in Planning Analytics and Oracle—using natural language prompts for “Ask Rinnai” use cases.

Lessons for CFOs

From Rinnai’s journey, there are clear takeaways for other finance leaders:

  1. Be bold and act early: Legacy systems will only get more expensive and harder to fix.

  2. Start with a strong foundation: Modernising reporting, budgeting, and forecasting enables AI to scale.

  3. Quantify benefits: Measure and communicate outcomes like hours saved, cycle time reduced, and morale lifted to keep momentum.

  4. Embed governance and culture: AI adoption requires upskilling teams and embedding robust controls.

  5. Think strategically: Modern platforms don’t just support finance—they enable faster M&A integration, strategic planning, and long-term growth.

The Bigger Picture: Finance as a Strategic Partner

What stands out most from the Rinnai story is how the role of finance has shifted. With automation and AI taking on manual processes, the finance team is now focused on:

  • Providing forward-looking insights through predictive analytics.

  • Partnering with the business on strategy, pricing, and resource planning.

  • Supporting growth through faster M&A integration.

  • Driving continuous improvement through new AI features and enhancements.

Finance has moved from a reactive scorekeeper to a proactive strategist.

Final Word

The Rinnai story proves that AI in finance is not a distant dream—it’s a present reality. With vision, leadership, and the right partners, CFOs can deliver faster, smarter, and more resilient finance functions that directly enable business growth.

The question is not if finance leaders should adopt AI, but how quickly they can embed it into their organisations.

Don’t wait until it’s harder and more expensive. Join us for this webcast and see how you can start your journey today.

WATCH RECORDING HERE


Line

Agentic vs. Classic Watsonx Orchestrate: Transforming Business Automation

Mode_Comment_Icon_black0
Alarm_Icon_15 min

In today’s fast-moving business environment, automation isn’t just a nice-to-have — it’s essential. IBM Watsonx Orchestrate has already helped many organisations streamline tasks, save time and improve productivity across teams. However, with the introduction of the Agentic version of Watsonx Orchestrate, a noticeable shift is occurring in how companies approach automation.

Unlike the Classic version, which relies on well-defined rules and task sequences, the Agentic approach introduces intelligent agents that understand goals, adapt to changing inputs, and even make decisions in real-time.

So, what’s the practical difference between the two versions? And more importantly, which one should you be using?

Let’s walk through it.

Agentic vs classic

Classic vs. Agentic: A different approach to getting things done

The Classic Watsonx Orchestrate setup works exactly how you’d expect a traditional automation tool to work. You build a step-by-step workflow — for example, “If form is submitted, send it to Person A, then update System B.” It’s reliable, consistent and ideal for tasks that rarely change, like data entry or approval chains.

Agentic Watsonx Orchestrate flips that on its head.

Instead of just executing steps, it starts with a goal — say, “onboard this new employee” — and figures out the best way to achieve that outcome. It plans, adjusts and even asks for help when needed. It’s built to handle the real world, where not everything goes according to plan.

In other words, Classic is scripted. Agentic is strategic.

How They Make Decisions: One Follows Rules, One Thinks for Itself

This is where things start to diverge.

  • Classic orchestration follows predefined rules. If X happens, do Y. It’s fast and efficient — as long as everything goes as expected.

  • Agentic Orchestrate, on the other hand, understands context. If the usual input is missing or something unexpected comes up, it doesn’t just fail — it adapts. It learns from interactions and updates its plan as needed.

This kind of dynamic decision-making makes Agentic a better fit for processes where flexibility, personalisation, or real-time problem-solving are required.

When to Use What: It Depends on the Complexity

Not every process needs a thinking agent. Many don’t.

Here’s a simple guide:

Use Case

Best Fit

Leave requests, form approvals

Classic

Employee onboarding

Agentic

Performance reviews, coaching

Agentic

Simple helpdesk responses

Classic or Agentic


If your process is straightforward and repeatable, Classic is a solid choice. But if there’s variation, personalisation, or a need for real-time judgment, Agentic wins hands down.

What’s the Real Impact?

Let’s talk numbers for a second. Organisations that have started using Agentic Orchestrate are seeing:

  • Up to 50% faster HR processing

  • 30–60% quicker onboarding

  • 25% higher satisfaction from employees using automated support services

That’s because these agents don’t just check boxes — they respond in real-time, offer suggestions and help both employees and managers stay on top of their goals. Think of it like having a digital colleague who understands what you're trying to achieve.

Classic automation answers “What needs to be done?”
Agentic automation answers “Why are we doing this, and what’s the best way to get there?”

How to Choose What’s Right for You

If you’re just starting out with automation, or if you want to get some quick wins by automating simple tasks, the Classic version will serve you well.

But if your goal is to rethink how your business operates — especially in areas like HR, IT, or customer support — the Agentic version is where you’ll start seeing transformative results.

In most cases, the best approach isn’t either/or. It’s both. Use Classic for structured processes and Agentic for the ones that benefit from adaptability and intelligence.

The Future: Smarter, Self-Improving Automation

Agentic Orchestrate isn’t just an upgrade — it’s a complete evolution in how we think about automation. With its ability to learn, adapt and personalise at scale, it opens the door to:

  • Workflows that improve over time

  • AI agents that respond based on real-world context

  • Better support and alignment across teams

This is where automation is headed — not just faster, but smarter.

Ready to Explore What Agentic Orchestrate Could Do for You?

Whether you’re trying to modernise HR, improve service desk responsiveness, or simply reduce the manual load across departments, Agentic Watsonx Orchestrate gives you tools that work like partners — not just programs.

Let’s start a conversation. The future of intelligent work is here — and it’s Agentic.

Line

IBM SaaS on AWS launches India – Supercharge your IBM Planning Analytics cloud journey with Octane!

Mode_Comment_Icon_black0
Alarm_Icon_12 min

Big news for Indian enterprises: IBM Planning Analytics as a Service is now officially available on AWS in India. This means faster performance, stronger data sovereignty, and AI-powered insights—all on a scalable cloud platform. At IBM India Services, together with Octane Software Solutions, we're excited to help you harness this opportunity.

AWS launch (1)

Why this AWS India expansion changes everything

  • Ultra-low latency for real-time planning & analytics

  • Local data residency for compliance with India's DPDP Act

  • IBM Planning Analytics on AWS - cloud-powered FP&A at scale

  • AI-enhanced insights through IBM's agentic AI capabilities

Meet Octane Software Solutions: India’s trusted IBM Planning Analytics experts

Octane Software Solutions is a leading IBM implementation partner, known for deep expertise in financial analytics and enterprise planning. Here’s why Indian enterprises trust Octane:

  • Home to 3 IBM Champions: Recognised by IBM for outstanding technical leadership and contribution to the global IBM community.

  • Winner of the 2025 IBM Partner Plus Award: A testament to Octane’s excellence in delivering high-impact, scalable solutions with IBM technologies.

  • Local expertise for Indian businesses: Deep understanding of compliance, data localisation, and sector-specific requirements in India.

  • Proven delivery methodology: A structured, risk-free approach that covers everything from cloud migration and solution customisation to training and optimisation.

Why choose IBM + Octane?

  • Best-in-class technology (IBM)+ 🛠️ Best-in-class implementation (Octane)

  • End-to-end journey support—from planning to ongoing success

  • Customisable, AI-powered FP&A solutions built for your needs

  • Security and compliance assurance for Indian regulatory standards

Take the next step today

Whether your business is:

  • Planning to modernise financial systems

  • Exploring AI-powered forecasting and analytics

  • Seeking to optimise cloud infrastructure and cost efficiency

Let’s make your vision a reality—quickly, securely, and intelligently.

📧 Contact Octane Software Solutions at hello@octanesolutions.com.au
Let’s build a customised roadmap to transform your planning and analytics on IBM Cloud + AWS India.


Line

From compliance to command: How IBM controller empowers the modern CFO

Mode_Comment_Icon_black0
Alarm_Icon_112 min

As the role of the CFO evolves from financial steward to strategic architect, the expectations have never been higher. 

CFOs today are expected to: 

  • Deliver rapid, accurate close cycles.  
  • Ensure compliance across a complex regulatory landscape. 
  • Provide forward-looking insights that drive executive decisions. 
  • Lead finance transformation in a data-driven world. 

integration (1)

This shift demands more than spreadsheets and legacy consolidation tools. It calls for intelligent automation, real-time transparency, and strategic control. 

This is where IBM Controller steps in as a financial consolidation platform and a strategic lever for modern CFOs. 

Why CFOs need more than just a close process

Financial close is no longer just a back-office routine; it’s a board-level priority. Late or inaccurate reporting can erode stakeholder trust, disconnected systems can slow you down, and manual errors open the door to audit risks. 

With IBM Controller, CFOs move from reactive to proactive by: 

  • Accelerating the close cycle without compromising accuracy. 
  • Ensuring compliance across multiple GAAPs, IFRS, and local statutory rules. 
  • Reducing manual effort with automated intercompany eliminations, minority interest handling, and ownership calculations. 
  • Maintaining full audit trails to satisfy internal and external audits effortlessly.

    Speed + Accuracy + Control = Confidence at Every Close. 

From static numbers to strategic narratives 

Today’s executive team needs more than a balance sheet. They need answers: 

  • What’s driving margin erosion? 

  • How are subsidiaries impacting group performance?

  • Where should we invest next?

IBM Controller delivers real-time insights, not just reports. When integrated with IBM Planning Analytics, CFOs can: 
  • Drill down into entity, region, or line-of-business level performance. 
  • Compare actuals vs. budget with clear variance explanations. 
  • Model multiple financial scenarios in the same ecosystem. 

This empowers CFOs to shift the narrative from “what happened” to “what’s next”, backed by data that leadership can trust. 

Built-in compliance, without the complexity 

The regulatory landscape is only getting tougher, taxonomies are changing, ESG requirements are emerging, and cross-border regulations are becoming more intricate. 

IBM Controller helps CFOs stay ahead by: 

  • Supporting multi-GAAP reporting and localisation. 
  • Offering governance frameworks with role-based controls and data lineage. 
  • Providing full auditability and traceability of financial data. 
  • Enabling continuous compliancenot just at quarter-end. 

This isn’t just regulatory peace of mind, it’s risk mitigation at scale. 

Scalability that matches business growth 

CFOs aren’t just managing today, they’re preparing for tomorrow. Whether it’s a merger, acquisition, spin-off, or expansion into new markets, the finance function must scale fast. 

IBM Controller delivers the agility to: 

  • Seamlessly onboard new entities and the chart of accounts. 
  • Adjust the consolidation logic as ownership structures evolve. 
  • Adapt to new taxonomies, KPIs, and compliance requirements. 

With a flexible, rule-driven architecture, IBM Controller grows as your business grows without rewriting your finance playbook. 

Cloud-powered, CFO-friendly 

Modern CFOs are embracing the cloud not just for IT efficiency, but for strategic advantage. 

IBM Controller on Cloud offers: 

  • Lower total cost of ownership, no infrastructure or heavy IT dependency.
  • Always-on availability, global scalability, and robust security.
  • Faster upgrades, with immediate access to new features and enhancements.

This allows finance teams to focus on what matters- strategy, performance, and growth, not system maintenance. 

One source of truth. Many paths to insight.

With IBM Controller, the CFO gains more than visibility, they gain command. 

The solution becomes a single source of truth for the office of finance. Whether you're reporting to the board, regulators, or investors, the numbers always align, no recon, no surprises. 

And with powerful integration to tools like IBM Planning Analytics, Cognos Analytics, and Excel, you’re not just seeing the past. You’re shaping the future

The Strategic Payoff: A CFO’s Competitive Advantage

Let’s be clear, IBM Controller isn’t just a tool for the finance team. It’s a strategic platform for CFOs who want to:

  • Close faster, with fewer errors

  • Ensure regulatory compliance across borders

  • Gain real-time visibility into performance

  • Scale finance operations with business growth

  • Drive executive decisions with confidence 

In an era where data is your most valuable asset and insight is your sharpest edge, IBM Controller puts you at the helm of financial command.

"Be the CFO who leads, not just reports"

You’re not just responsible for the numbers, you’re shaping the story they tell. 

With IBM Controller, you gain the speed, clarity, and control to lead with impact every quarter, every decision, every time. 

Line

Octane wins 2025 IBM Partner Plus award in APAC: How agentic automation is shaping the future of work

Mode_Comment_Icon_black0
Alarm_Icon_15 min

In a world where speed, scale, and trust define success, Octane has emerged as a leader in enterprise AI-driven transformation. Honoured with the 2025 IBM Partner Plus Award in APAC for automation, Octane’s groundbreaking use of IBM Watsonx Orchestrate is setting a new benchmark for how intelligent automation can empower business users and scale human productivity.

The Award: Increasing performance through automation

IBM Partner Plus Awards_Automation_Geo Winners Tile_APAC_LinkedIn

The IBM Partner Plus Award for Automation celebrates business partners who are delivering new levels of performance with speed, scale and security, enabling systems, business processes, and people to be more efficient.

For Octane, this means:

  • Speed: Accelerating workflows by over 70% through AI orchestration.

  • Adaptability: Designing solutions that flex with business demands.

  • Security: Ensuring compliance through enterprise-grade automation guardrails.


“This award reinforces our belief that automation should be intuitive, intelligent, and human-first,” said Amendra Pratap, Managing Director. “Our collaboration with IBM brings this vision to life.”

IBM Watsonx Orchestrate: A new paradigm in intelligent automation

Watsonx Orchestrate is IBM’s enterprise-ready solution that helps create, deploy, and manage AI assistants and agents. It blends AI and workflow automation, enabling users to interact with systems using natural language prompts, representing a powerful step toward fully autonomous agentic AI systems. It enables multi-step, goal-driven task orchestration and integration with existing business systems, connecting to multiple proprietary and third-party AI models and automation tools.

How Octane leverages Watsonx Orchestrate:

  • Skill-based AI execution: Prebuilt “skills” automate repetitive actions—like sending emails, updating records, or scheduling interviews.
  • No-code integrations: Plug-and-play connections to enterprise tools like SAP, Salesforce, and Workday.
  • Conversational interface: Users trigger complex workflows through Slack, Teams, or email with simple prompts.

“Watsonx Orchestrate isn’t just for building chatbots—it’s an AI-powered teammate,” says Amendra Pratap, Managing Director, “Watsonx Orchestrate is your next hire. By orchestrating tasks across various assistants, agents and systems, it helps boost workforce efficiency and reduces manual load by surfacing the right tools when you need them."

Real-world impact:

Fiji Airways Report Generation with PA x orchestrate - PoR_10-1

What we achieved:

Fiji Airways Report Generation with PA x orchestrate - PoR_11

What sets Octane apart: Augmented intelligence, not just automation

Traditional automation follows rules. Octane uses AI to understand goals, context, and next best actions.

With Watsonx Orchestrate, Octane delivers:

  • Adaptive workflows: Adjusts based on real-time data (e.g., re-routing approvals during outages).
  • Multi-agent collaboration: Skills collaborate (e.g., sentiment analysis + ticket escalation).
  • Continuous learning: Models improve from feedback to streamline operations over time.

“We don’t just automate tasks—we augment thinking,” says Steny Sebastian, Principal - Data and AI Platforms. “That’s how we deliver smarter outcomes, not just faster ones.”

Ready to orchestrate intelligence into every workflow?

 Explore how Octane’s award-winning AI solutions can help you scale with confidence.

Learn how advanced your organisation is with AI adoption and how Orchestrate can help. - Take the next step. Try IBM Watsonx Orchestrate at no cost, or book a consultation with an expert

Learn more about the IBM Partner Plus Awards: https://www.ibm.com/partnerplus/awards

#AgenticAI #EnterpriseAutomation #OctaneSolutions #WatsonxOrchestrate #IBMPartnerPlus #DigitalTransformation

Line

Embracing the future with AI: My thrilling first week at Octane Software Solutions

Mode_Comment_Icon_black0
Alarm_Icon_111 min

There’s nothing quite like starting a new role at the forefront of innovation. My first week at Octane Software Solutions was nothing short of electrifying—the highlight was a full-house customer event buzzing with energy, visionary ideas, and the promise of AI-driven transformation. 

The focus?

IBM AI Platform,  Watsonx Orchestrate, is poised to redefine how businesses harness automation, AI agents, and predictive intelligence to unlock unprecedented efficiency. Let me take you through this exhilarating journey and why Watsonx Orchestrate, paired with Octane’s expertise, is the future of work.  

A screenshot of a white sheet with blue text
AI-generated content may be incorrect.

As we close out 2024, a year that has been revolutionary for AI adoption, let’s pause to reflect on the data driving this transformation. Companies have spent 2023-2024 experimenting with generative AI, deploying AI assistants, and running pilots, many of which have evolved into concrete plans for 2025. Now, the focus shifts to finding the right partner to turn these blueprints into reality. 

These statistics aren’t just metrics; they prove that AI is fulfilling its promise to amplify productivity while elevating outcomes. Here’s how Watsonx Orchestrate’s AI agents are reshaping enterprises: 

  1. Enhanced User Experience 

    AI agents deliver intelligent, multi-turn conversational experiences that solve complex tasks seamlessly. For instance, integrating Watsonx Orchestrate with tools like IBM Planning Analytics (TM1) allows finance teams to automate data reconciliation while maintaining compliance.

  2. Reduced Total Cost of Ownership (TCO) 

    By leaning on AI to automate tasks at scale, enterprises cut costs while boosting efficiency. Watsonx Orchestrate’s pre-built Skills and low-code studio let businesses extend existing Gen AI investments—like chatbots or co-pilots—without overhauling systems.

  3. Agility & Future-Proof Flexibility 

    AI agents enable organisations to pivot rapidly as markets shift. With Watsonx Orchestrate’s autonomous orchestration, businesses adapt workflows in real-time, whether rerouting customer inquiries during peak demand or updating financial forecasts using TM1.

If below is what you are thinking: 

  • How do you integrate AI agents into your existing digitised workflows?
  • How do you maximise ROI from current AI tools?
  • How do you retain control as AI evolves?

Octane: Is Your Partner for Scaling Customer-Centric AI

While many providers offer AI tools, Octane stands apart as a force for customer-centric innovation. Here’s why: 

A screenshot of a business
AI-generated content may be incorrect.

We don’t believe in one-size-fits-all solutions. Together with IBM, Octane’s team works side-by-side with clients to:

  • Map AI use cases to your unique customer journey.
  • Integrate Watsonx capabilities with niche tools  
  • Prioritise ethical AI practices, ensuring transparency and trust at every interaction. 

Octane: Delivering Real-World Impact with Watsonx Orchestrate—An Airline’s Journey to AI-Driven Intelligence 

Let’s cut through the hype and dive into a tangible example of how IBM Watsonx Orchestrate, implemented by Octane, transformed operations for a global airline—a case study that exemplifies the platform’s power to turn data chaos into strategic clarity. 

The Challenge: Manual Mayhem in Business Intelligence 

The airline’s Business Intelligence (BI) and Finance teams were drowning in manual processes: 

  • 2-3 days wasted monthly on report generation, with analysts manually cleaning, reconciling, and validating data in IBM Planning Analytics (TM1).
  • Knowledge bottlenecks: Executives relied on BI teams for real-time insights during critical meetings, creating delays and frustration.
  • Human errors: Manual calculations led to costly rework, while commercial decisions were stalled by a 3-week data validation cycle. 

The stakes? Missed deadlines, strained resources, and executives flying blind in a competitive market. 

The Solution: Watsonx Orchestrate in Action

Octane partnered with the airline to integrate Watsonx Orchestrate with their existing IBM Planning Analytics deployment. In just two weeks, we automated workflows and unleashed AI-driven efficiency:

A screenshot of a computer
AI-generated content may be incorrect.

Automated Data Cleaning & Reconciliation 

  • AI-Powered Automation: 
  • Manual data cleaning reduced from 2-4 days/month to minutes. 
  • Data reconciliation slashed from 3-4 hours/month to 1 minute. 
  • Self-Correcting Workflows: 
    Watsonx Orchestrate’s AI agents flagged inconsistencies, auto-corrected errors, and validated datasets, ensuring 99% accuracy in financial reports. 

Empowering Executives with NLP-Driven Insights

  • Natural Language Queries: 
    Executives could now ask, “Show me Q3 revenue trends vs. forecasts” in plain language. Watsonx Orchestrate generated real-time insights, reducing reliance on BI teams by 90%. 
  • Faster Decisions: 
    Monthly reports that once took 2-3 days were generated in 10 minutes, accelerating commercial decisions from weeks to hours. 

Eliminating Knowledge Silos

  • Democratized Data Access: 
    By codifying tribal knowledge into AI workflows, the airline mitigated key-person risk and ensured continuity during staff turnover. 
  • Scalable Governance: 
    Octane embedded compliance checks into automated processes, aligning with IBM’s enterprise-grade LLMs for audit-ready outputs. 

Business Outcomes: From Friction to Flight 

A screenshot of a web page
AI-generated content may be incorrect.


"With Octane and Watsonx Orchestrate, we’re not just surviving data chaos—we’re soaring above it." - Fortune 500 Airline Client

Three Pathways to AI Transformation 

  1. Test-drive Watsonx Orchestrate on our dedicated platform  

  2. Client Briefing: Dive deep into a 2-4 hour session to align AI strategy with your goals.

  3. Pilot Program: Co-develop a 1-4 week proof-of-concept with Octane’s AI engineers. 

The Future is Autonomous—Let’s Build It Together

Reflecting back on the event, the energy in the room was infectious. Attendees left inspired by Watsonx Orchestrate’s ability to blend autonomous AI with human ingenuity. By automating the mundane, enhancing precision, and scaling seamlessly, this platform isn’t just a tool—it’s a productivity revolution. 

As I begin my journey with Octane, I’m energised by the possibilities. Whether you’re optimising finance with TM1, Anaplan, transforming employee productivity with SAP, or reimagining customer service with Salesforce / ServiceNow, IBM Watsonx Orchestrate—powered by Octane—is your catalyst for growth. The future of enterprise productivity isn’t just automated—it’s augmented. With AI Agents handling the grind, your team can focus on what humans do best: innovating, strategising, and delivering exceptional value.

Ready to turn your 2025 AI vision into reality?

Contact Octaneto discover how Watsonx Orchestrate can accelerate your journey—with the stats to back it up. 

Steny Sebastian
Principal - Data and AI Platforms
Octane Solutions 🗓️ Book me
https://www.octanesolutions.com.au/

Line

IBM Planning Analytics AI assistant - revolutionising business planning with artificial intelligence

Mode_Comment_Icon_black0
Alarm_Icon_17 min

In today’s fast-paced business environment, companies are constantly looking for ways to streamline their operations, improve decision-making, and stay ahead of the competition. One of the tools that has gained significant attention in the world of business intelligence and analytics is IBM Planning Analytics, which harnesses the power of AI to enhance financial planning, forecasting, and reporting. One of the standout features of IBM Planning Analytics is its AI Assistant, an innovative tool that leverages artificial intelligence to provide smarter, more efficient planning and analytics capabilities.

AI in finance and watsox orchestrate-1


In this blog, we’ll dive into the key features of the IBM Planning Analytics AI Assistant and explore how it is transforming business planning for organisations around the world.

What is IBM Planning Analytics AI Assistant?

IBM Planning Analytics is a cloud-based solution designed to help businesses automate their planning, budgeting, forecasting, and analysis processes. The AI Assistant embedded within the platform brings cognitive capabilities to the table, making it more intuitive and user-friendly.

The AI Assistant uses natural language processing (NLP) and machine learning algorithms to understand and respond to user queries in plain language, enabling business users—whether financial analysts, planners, or executives—to interact with the system more naturally. Instead of relying on complex formulas or spending hours running reports, users can simply ask questions like, "What was our sales growth in Q3?" or "How much did our expenses increase year-over-year?" The AI Assistant then processes these requests and provides quick, data-driven insights.

Key Features of IBM Planning Analytics AI Assistant

  1. Conversational analytics

    One of the most impressive features of the AI Assistant is its ability to enable conversational analytics. Traditionally, getting insights from business intelligence tools involved navigating through multiple layers of data, setting up reports, or writing complex queries. The AI Assistant eliminates this complexity by allowing users to ask questions in natural language, just like they would talk to a colleague or consultant.

    For example, a user can ask, "What were our sales for last quarter?" and the AI Assistant can instantly pull up relevant data, graphs, or reports. This conversational interface makes it easier for non-technical users to engage with analytics and access valuable insights without having to be data experts.

  2. Data-driven decision-making

    The AI Assistant doesn’t just provide static answers—it actively helps users analyse trends, identify anomalies, and make data-driven decisions. For instance, the Assistant can compare historical data, identify seasonal patterns, and even suggest potential adjustments to forecasts based on changing market conditions. This empowers decision-makers to quickly assess different scenarios and make informed choices.

    Additionally, the Assistant can provide context behind the data, such as explanations of why certain numbers are trending upward or downward. This deeper level of understanding enables organisations to plan with greater confidence.

  3. Predictive analytics and forecasting

    In addition to assisting with retrospective analysis, the AI Assistant is also equipped to help users with predictive analytics. Using historical data, market trends, and other variables, the Assistant can generate forecasts for various business aspects like sales, revenue, and operational costs.

    For instance, planners can ask the AI Assistant, "What is the projected revenue for the next quarter based on current trends?" The Assistant then leverages machine learning models to provide accurate, forward-looking forecasts. By incorporating AI-driven insights, businesses can improve their planning accuracy and reduce the risks associated with manual forecasting.

  4. Automated insights and recommendations

    One of the standout benefits of AI in business planning is its ability to go beyond simple reporting. The IBM Planning Analytics AI Assistant is capable of delivering automated insights and recommendations that are tailored to the needs of the organisation. By analysing past performance, the Assistant can highlight areas of opportunity or potential risk that may require attention.

    For example, if expenses are increasing faster than revenue, the Assistant might recommend strategies for cost-cutting or optimising operations. These automated recommendations allow planners and analysts to quickly address potential issues and capitalise on emerging opportunities.

  5. Seamless integration with IBM Planning Analytics Workspace

    The AI Assistant is fully integrated with the IBM Planning Analytics Workspace, which is the central hub for business users to manage and analyse data. This integration ensures that users have a smooth experience when interacting with their data, whether they are leveraging the AI Assistant for ad-hoc analysis or using the broader tools available in Planning Analytics for long-term strategic planning.

    The seamless integration between the Assistant and the workspace also means that businesses can continue to rely on traditional data management and reporting workflows while taking advantage of AI-powered insights without disruption.

Benefits of IBM Planning Analytics AI assistant

AI in finance and watsox orchestrate

  • Faster Decision-Making

    The AI Assistant accelerates decision-making by delivering insights in real-time. Users can ask questions and get answers instantly, without having to manually sift through large datasets or run complex queries. This speeds up planning cycles and ensures that decisions are based on the latest data.

  • Empowerment of Business Users

    With the AI Assistant, business users who may not have deep technical expertise can now access analytics and make informed decisions. This democratisation of data ensures that all teams—finance, marketing, operations—are equipped to contribute to planning processes and drive organisational success.

  • Reduced Errors

    Since the AI Assistant uses machine learning models to predict and analyse data,  the likelihood of human error in forecasting and planning is significantly reduced. Automated insights and recommendations are based on sophisticated data analysis, helping to eliminate mistakes caused by manual data handling.

  • Scalable Insights Across Teams

    The AI Assistant enables businesses to scale their analytics capabilities across teams and departments. Whether a team is working on financial forecasts, sales targets, or operational efficiencies, the Assistant can be used to generate insights that are relevant to each department’s specific goals and objectives. This scalability ensures that AI-powered decision-making benefits the entire organisation.

Real-World Use Cases

  1. Finance Teams

    For finance teams, the AI Assistant is a game-changer in managing budgets, forecasting, and scenario planning. It can quickly identify deviations from expected results, recommend corrective actions, and forecast the financial outlook based on real-time data.

  2. Sales and Marketing Teams

    Sales and marketing teams can use the Assistant to gain quick insights into customer behaviour, sales trends, and marketing ROI. By understanding which campaigns are driving results and which aren’t, they can adjust strategies on the fly and optimise their efforts.

  3. Operations and Supply Chain

    Operations managers can use the AI Assistant to forecast demand, optimise inventory, and predict potential supply chain disruptions. By understanding these dynamics earlier, businesses can mitigate risks and improve operational efficiency.

Conclusion

The IBM Planning Analytics AI Assistant represents a significant leap forward in the world of business analytics. By combining artificial intelligence, natural language processing, and predictive analytics, it transforms the way businesses plan, forecast, and make decisions. With its ability to provide faster insights, automate recommendations, and empower users across the organisation, the AI Assistant is not just a tool—it’s a strategic asset that helps businesses become more agile and data-driven in their operations.

As businesses continue to face increasingly complex challenges, tools like IBM Planning Analytics AI Assistant will become indispensable for navigating the future of planning and decision-making.

Ready to take AI to the next level? Talk to us! 

Line

Dipping your toes into AI in Finance with Watson Orchestrate: A Step-by-Step Journey

Mode_Comment_Icon_black0
Alarm_Icon_17 min

The world of finance is evolving rapidly, and AI is no longer a futuristic concept—it’s a practical tool that can transform how finance teams operate. But for many organisations, the idea of integrating AI into their workflows can feel overwhelming. Where do you start? How do you ensure success? The answer lies in taking a gradual, strategic approach. With Watson Orchestrate and IBM Planning Analytics, you can start small, prove the value, and confidently scale your AI initiatives. At Octane, we guide you through this journey, from exploring use cases to delivering impactful projects.

A diagram of a diagram of gears
AI-generated content may be incorrect. 


Why Start Small with AI in Finance? 

AI has the potential to revolutionise finance by automating repetitive tasks, enhancing decision-making, and improving accuracy. However, diving headfirst into a full-scale AI implementation can be risky. Starting small allows you to test the waters, build confidence, and demonstrate tangible results before committing to larger investments. This is where Watson Orchestrateshines—it’s designed to integrate seamlessly with your existing tools, like IBM Planning Analytics, and automate specific tasks without disrupting your workflows. 

Step 1: Explore Use Cases with Octane’s Workshops 

The first step in your AI journey is identifying where it can add the most value. We work closely with IBM client engineering team and run interactive workshops to help you explore potential use cases for Watson Orchestrate within your finance team. These workshops are designed to: 

  • Understand Your Pain Points: We work with your team to identify repetitive, time-consuming tasks that are ripe for automation, such as data consolidation, report generation, or budget reconciliation. 
  • Brainstorm Solutions: Together, we brainstorm how Watson Orchestrate can address these challenges, leveraging its AI capabilities to automate processes and enhance efficiency. 
  • Prioritise Opportunities: Not all use cases are created equal. We help you prioritise the ones that offer the quickest wins and the highest impact. 

Step 2: Prove the Value with a Proof of Concept (POC) 

Once we’ve identified promising use cases, the next step is to validate them through aProof of Concept (POC). A POC allows you to see Watson Orchestrate in action, delivering real results in a controlled environment. Here’s how it works: 

  • Define Success Metrics: We work with you to define clear objectives and success metrics for the POC, ensuring that the results are measurable and aligned with your goals. 
  • Build and Test: Our team builds the POC, integrating Watson Orchestrate with IBM Planning Analytics to automate the selected use case. We test the solution rigorously to ensure it meets your requirements. 
  • Evaluate Results: After the POC, we evaluate the results together. Did it save time? Improve accuracy? Enhance productivity? These insights help you decide whether to move forward with a full-scale implementation. 

Step 3: Deliver the Project and Scale 

If the POC demonstrates value, we move into the  project delivery phase. Our team works closely with yours to implement the solution, ensuring it’s tailored to your specific needs and integrated seamlessly into your workflows. Once the initial project is delivered, you can scale the solution to address additional use cases, gradually expanding the role of AI in your finance operations. 

Real-World Impact: A Gradual Approach to AI 

Many organisations have successfully adopted AI in finance by starting small and scaling strategically. For example, an airline participated in one of Octane’s workshops and identified report generation as a key pain point. Through a POC, they automated the process using Watson Orchestrate, reducing the time required from 2 days to just 30 minutes. Encouraged by the results, they expanded the solution to automate budget reconciliation, achieving even greater efficiencies. 

Why Choose Octane? 

At Octane, we specialise in helping organisations like yours navigate the complexities of AI adoption in Finance teams. Our phased approach—starting with workshops, moving to POCs, and then delivering projects—ensures that you can dip your toes into AI without taking on unnecessary risk. We bring deep expertise in Watson Orchestrate and IBM Planning Analytics, along with a commitment to delivering measurable results.  

Take the First Step Today 

AI is no longer a distant dream—it’s a practical tool that can transform your finance team. By starting small with Watson Orchestrate and IBM Planning Analytics, you can explore the potential of AI, prove its value, and scale your initiatives with confidence. Ready to get started? Contact Octane today to schedule a workshop and begin your AI journey. Email us at  media@octanesolutions.com.au  to learn more. 

The future of finance is AI-powered, and the journey starts with a single step. Let Octane guide you every step of the way. 

Line

Balancing year-end demands: Top 5 stress-free approach for Finance Teams this festive season

Mode_Comment_Icon_black0
Alarm_Icon_16 min

The holiday season is a time for joy, relaxation, and quality time with loved ones. However, for many finance teams, it’s also a period of intense activity. Year-end closings, budgeting, and reporting deadlines can pile up, creating a stressful and demanding environment.

TM1 newsletter (3)-3

Imagine spending your holiday season worrying about potential system outages, data load failures, or urgent user queries. It’s a scenario that can disrupt your well-deserved break and compromise your team’s productivity.

Leverage Dedicated TM1 Support During the Holidays

  • Engage a reliable TM1 support partner to handle system maintenance, troubleshooting, and year-end processes so your team can enjoy a well-deserved break without stress.

Automate Routine Tasks and Processes in TM1

  • Use TM1’s automation capabilities to schedule recurring tasks like data loads, reconciliations, and report generation, ensuring everything runs smoothly while minimizing manual effort.

Ensure Proactive Monitoring and Downtime Prevention

  • A TM1 support team can proactively monitor your environment, identify potential issues before they escalate, and ensure critical systems remain up and running during the festive season.

Outsource Last-Minute Reporting and Forecasting Support

  • Avoid scrambling to meet year-end deadlines by outsourcing TM1 reporting tasks to a team that can handle changes, corrections, and urgent requests with expertise and speed.

Plan Ahead with a Holiday Support Coverage Model

  • Partner with a TM1 managed services provider who offers holiday-specific coverage, ensuring your team has access to skilled resources when needed, without disrupting workflows or personal time.

Why TM1 support (Octane Blue) is the Perfect Solution 

That’s where Octane Blue comes in. Our comprehensive support service is designed to alleviate your holiday stress and ensure business continuity. With 40 hours of dedicated support, you can rest easy knowing that your TM1 environment is in expert hands.

What Does Octane Blue Offer? 

  1. Proactive System Monitoring: Our team will keep a watchful eye on your TM1 environment, identifying and resolving potential issues before they escalate. 

  2. Rapid Incident Response: Should any issues arise, our experienced support engineers will be on hand to diagnose and fix them promptly. 

  3. Data Load and Reconciliation Support: We’ll assist with data load processes, ensuring accurate and timely data integration.

  4. Security and Access Management: Our team will help maintain the security of your TM1 environment and manage user access rights. 

  5. Security and Access Management: Our team will help maintain the security of your TM1 environment and manage user access rights.

  6. Technical and Functional Support: We’ll provide expert guidance on a wide range of TM1 topics, from technical troubleshooting to functional best practices.

  7. User Support: Our team will be available to assist your users with any questions or issues they may encounter. 

Frequently Asked Questions

How many hours of support are included in Octane Blue? 
  • 40 hours. 
What happens if I don’t use all 40 hours during the festive season? 
  • Unused hours will be rolled over for one additional month. 
Do I need to be an existing Octane client to sign up for Octane Blue? 
  • No, Octane Blue is available on any TM1 site. 
Do I need to sign a long-term contract? 
  • No, you can purchase Octane Blue on a one-time basis or as needed. 
How much does Octane Blue cost? 
How do I purchase Octane Blue? 
Can I schedule a meeting to discuss Octane Blue further? 

Don’t let the holiday season stress you out. Let Octane Blue take care of your TM1 environment so that you can enjoy a peaceful and productive holiday. 

Line

Highlights & Triumphs: IBM TechXchange 2024

Mode_Comment_Icon_black0
Alarm_Icon_14 min

Attending IBM TechXchange in Mandalay Bay, Las Vegas was an exhilarating experience that showcased the cutting-edge IBM technologies shaping various industries today. The conference brought together technologists, IBM Champions, thought leaders, industry experts, and innovators eager to share insights and explore the latest advancements in IBM's technology portfolio. From AI to cloud computing, the event highlighted how these tools are transforming businesses, making operations more efficient, and ultimately driving better decision-making.

As an IBM champion we were treated as VIPs with row seats in all keynote sessions, special champions lounge and special dinners and networking sessions. It was great to see IBM champions sporting the blue jackets throughout the conference.

One of the standout moments for me was the opportunity to present alongside Ashika Singh from Fiji Airways. Our session focused on their usage of IBM Planning Analytics, which allowed Fiji Airways to navigate the challenges posed during the COVID-19 shutdown. The pandemic created unprecedented obstacles for the airline industry, with travel restrictions and safety concerns leading to a dramatic decline in passenger numbers. However, Fiji Airways leveraged IBM Planning Analytics to make data-driven decisions that prepared them for the eventual reopening of global travel.

During our presentation, we shared how the airline utilised forecasting and scenario planning capabilities in the tool to assess various outcomes and devise strategies for recovery. By analysing all drivers and generating up to 60- what-if scenarios at a time, Fiji Airways was able to predict future demand and align their resources accordingly. This proactive approach not only ensured they were ready when the skies reopened but also positioned them to adapt quickly to changing circumstances, ultimately enhancing their resilience. This led to numerous awards and Fiji Airways is now ranked 14th in the world in Skytrax ranking 2024. They have overtaken Qantas and Air New Zealand which traditionally dominated the rankings in the region.

The discussions throughout the conference were incredibly enlightening. Industry leaders spoke about the importance of digital transformation and how organizations must prioritise agility and innovation to thrive in today's fast-paced environment. There was a strong emphasis on how leveraging AI and analytics can unlock new opportunities, streamline operations, and create a more personalized customer experience. These insights resonate deeply, especially in sectors like travel and hospitality that have been profoundly affected by global events.

Networking opportunities were plentiful at TechXchange, allowing me to connect with other professionals who share a common goal of harnessing technology for business growth. Conversations flowed about the challenges and triumphs faced during the pandemic, highlighting how collaboration and knowledge-sharing have played vital roles in overcoming adversity. Each conversation reinforced the idea that we are all part of a larger community that supports each other's journeys toward transformation. There were lots of opportunities to network with other TM1 specialists from around the world.

The event was also filled with hands-on labs and demonstrations, showcasing IBM's latest products and solutions. Exploring new functionalities and engaging with the technology firsthand enhanced my understanding of how these tools can be applied in various contexts. It was exciting to envision how businesses can harness these innovations to optimize their operations and improve overall performance. IBM also used the conference to announce the launch of the Granite 3.0 AI model. (Read more here Granite 3.0)

Looking back on my experience at IBM TechXchange, I am inspired and optimistic about the future. Planning Analytics has a range of new functionality to improve performance, deployment options and integration of IBM AI onto the platform will cement its position as a leader in the XP&A space. Presenting with Ashika was a highlight that illustrated not only the adaptability of Fiji Airways but also the potential of data-driven decision-making for all of our clients. There was a lot of interest in how we integrate Watson Orchestrate with Planning Analytics to boost the AI functionality in finance teams.

In conclusion, attending IBM TechXchange has provided a great platform to see where IBM is going in the future – and it's looking exciting. As AI becomes more mainstream and use cases continue to evolve it was interesting to see how our peers and IBM are harnessing this technology to deliver business value for clients. The dates for 2025 Techxchange in Orlando are already announced and Octane will once again attend along with our clients. (More details IBM Techxchange conference)


Line

Enhancing Planning Analytics Workspace (PAW) visualisations using MDX

Mode_Comment_Icon_black0
Alarm_Icon_15 min

Planning Analytics Workspace (PAW) offers a robust suite of visualizations, enabling users to create rich and compelling reports and dashboards with remarkable flexibility. However, even with these capabilities, you may occasionally encounter requirements that push the limits of what PAW provides out of the box. 

One such scenario I encountered was the need to create a column chart comparing Actual vs Budget variance. The twist? Any negative variance should be highlighted with a red bar, while positive variance should be displayed in green, as shown below: 

A screenshot of a computer screen
Description automatically generated

PAW’s default settings don't currently offer this kind of custom conditional formatting for visualizations. However, with a little MDX magic and a few formatting tweaks, you can achieve this effect in just five simple steps. 

Step-by-Step Guide to Creating Custom Visualizations in PAW 

Step 1: Position the Version Dimension in the Column 

Start by positioning the Version dimension in the column of the Exploration view. This is where we will apply the MDX logic to derive the desired results. 

Step 2: Use MDX to Create Calculated Members 

Next, you'll need to update the MDX query by creating three calculated members to represent Actual vs Budget (AvB), Positive Variance, and Negative Variance. 

Here’s the MDX code: 

MDX code: 

WITH  

MEMBER [Version].[Version].[AvB] AS [Version].[Version].[Actual] - [Version].[Version].[Budget]  

MEMBER [Version].[Version].[Positive] AS IIF([Version].[Version].[AvB] > 0, [Version].[Version].[AvB], "") 

MEMBER [Version].[Version].[Negative] AS IIF([Version].[Version].[AvB] < 0, [Version].[Version].[AvB], "") 

Note: The AvB calculation could also be done using a consolidated member in the Version dimension, where the Budget has a negative weight. 

Step 3: Replace the MDX in the Row Axes 

Now, replace the MDX in the Row Axes relating to the Version dimension to show only the Positive and Negative calculated members, while excluding the AvB calculation (and any other member): 

MDX code: 

    EXCEPT( 

        { 

            [Version].[Version].[AvB], 

            [Version].[Version].[Positive], 

            [Version].[Version].[Negative] 

        },  

        { 

            [Version].[Version].[AvB] 

        },  

        ALL 

    ) 

This MDX will generate a view that displays only Positive and Negative members in the Version dimension, leaving the non-relevant member (whether positive or negative) as blank, depending on the AvB value. 

Step 4: Convert the Exploration View into a Column Chart

Once the MDX has been applied, convert the Exploration view into a Column Chart. By default, PAW will show the columns for positive and negative values with its standard color scheme.  

A graph of a number of states
Description automatically generated


Step 5: Apply a Custom Color Palette 

To finalize the visualization, we’ll apply a custom color palette. Navigate to the visualization properties and create a color palette that includes only two colors: green for positive values and red for negative values. 

A blue and white flag
Description automatically generated with medium confidence

Conclusion 

With just a few lines of MDX and a bit of customization, you can significantly enhance PAW visualizations. This technique allows you to move beyond the standard out-of-the-box options, giving you the flexibility to create more intuitive and visually effective reports. Whether you're comparing Actual vs Budget or any other metrics, these methods help you build visuals that not only convey the necessary information but do so in a way that is easy to interpret at a glance. 

By leveraging MDX and PAW’s formatting tools, you can push the boundaries of your reporting and create dynamic, insightful dashboards tailored to your business needs. 


Line

Integrating transactions logs to web services for PA on AWS using REST API

Mode_Comment_Icon_black0
Alarm_Icon_15 min

In this blog post, we will showcase the process of exposing the transaction logging on Planning Analytics (PA) V12 on AWS to the users. Currently, in Planning Analytics there is no user interface (UI) option to access transaction logs directly from Planning Analytics Workspace. However, there is a workaround to expose transactions to a host server and access the logs. By following these steps, you can successfully access transaction logged in Planning Analytics V12 on AWS using REST API.

integratetranslogs-ezgif.com-optimize

Step 1: Creating an API Key in Planning Analytics Workspace

The first step in this process is to create an API key in Planning Analytics Workspace. An API key is a unique identifier that provides access to the API and allows you to authenticate your requests.

  1. Navigate to the API Key Management Section: In Planning Analytics Workspace, go to the administration section where API keys are managed.
  2. Generate a New API Key: Click on the option to create a new API key. Provide a name and set the necessary permissions for the key.
  3. Save the API Key: Once the key is generated, save it securely. You will need this key for authenticating your requests in the following steps.

Step 2: Authenticating to Planning Analytics As a Service Using the API Key

Once you have the API key, the next step is to authenticate to Planning Analytics as a Service using this key. Authentication verifies your identity and allows you to interact with the Planning Analytics API.

  1. Prepare Your Authentication Request: Use a tool like Postman or any HTTP client to create an authentication request.
  2. Set the Authorization Header: Include the API key in the Authorization header of your request. The header format should be Authorization: Bearer <API Key>.
  3. Send the Authentication Request: Send a request to the Planning Analytics authentication endpoint to obtain an access token.

Detailed instructions for Step 1 and Step 2 can be found in the following IBM technote:

How to Connect to Planning Analytics as a Service Database using REST API with PA API Key

Step 3: Setting Up an HTTP or TCP Server to Collect Transaction Logs

In this step, you will set up a web service that can receive and inspect HTTP or TCP requests to capture transaction logs. This is crucial if you cannot directly access the AWS server or the IBM Planning Analytics logs.

  1. Choose a Web Service Framework: Select a framework like Flask or Django for Python, or any other suitable framework, to create your web service.
  2. Configure the Server: Set up the server to listen for incoming HTTP or TCP requests. Ensure it can parse and store the transaction logs.
  3. Test the Server Locally: Before deploying, test the server locally to ensure it is correctly configured and can handle incoming requests.

For demonstration purposes, we will use a free web service provided by Webhook.site. This service allows you to create a unique URL for receiving and inspecting HTTP requests. It is particularly useful for testing webhooks, APIs, and other HTTP request-based services.

Step 4: Subscribing to the Transaction Logs

The final step involves subscribing to the transaction logs by sending a POST request to Planning Analytics Workspace. This will direct the transaction logs to the web service you set up.

Practical Use Case for Testing IBM Planning Analytics Subscription

Below are the detailed instructions related to Step 4:

  1. Copy the URL Generated from Webhook.site:
    • Visit siteand copy the generated URL (e.g., https://webhook.site/<your-unique-id>). The <your-unique-id> refers to the unique ID found in the "Get" section of the Request Details on the main page.

  1. Subscribe Using Webhook.site URL:
    • Open Postman or any HTTP client.
    • Create a new POST request to the subscription endpoint of Planning Analytics.
    • In Postman, update your subscription to use the Webhook.site URL using the below post request:

  • In the body of the request, paste the URL generated from Webhook.site:

{
 "URL": "https://webhook.site/your-unique-id"
}
<tm1db> is a variable that contains the name of your TM1 database.

Note: Only the transaction log entries created at or after the point of subscription will be sent to the subscriber. To stop the transaction logs, update the POST query by replacing /Subscribe with /Unsubscribe.

By following these steps, you can successfully enable and access transaction logs in Planning Analytics V12 on AWS using REST API.

Line

Tips on how to manage your Planning Analytics (TM1) effectively

Mode_Comment_Icon_black0
Alarm_Icon_13 min

Effective management of Planning Analytics (TM1), particularly with tools like IBM’s TM1, can significantly enhance your organization’s financial planning and performance management. 

TM1 newsletter

Here are some essential tips to help you optimize your Planning Analytics (TM1) processes:

1. Understand Your Business Needs

Before diving into the technicalities, ensure you have a clear understanding of your business requirements. Identify key performance indicators (KPIs) and metrics that are critical to your organization. This understanding will guide the configuration and customization of your Planning Analytics model.

2. Leverage the Power of TM1 Cubes

TM1 cubes are powerful data structures that enable complex multi-dimensional analysis. Properly designing your cubes is crucial for efficient data retrieval and reporting. Ensure your cubes are optimized for performance by avoiding unnecessary dimensions and carefully planning your cube structure to support your analysis needs.

3. Automate Data Integration

Automating data integration processes can save time and reduce errors. Use ETL (Extract, Transform, Load) tools to automate the extraction of data from various sources, its transformation into the required format, and its loading into TM1. This ensures that your data is always up-to-date and accurate.

4. Implement Robust Security Measures

Data security is paramount, especially when dealing with financial and performance data. Implement robust security measures within your Planning Analytics environment. Use TM1’s security features to control access to data and ensure that only authorized users can view or modify sensitive information.

5. Regularly Review and Optimize Models

Regularly reviewing and optimizing your Planning Analytics models is essential to maintain performance and relevance. Analyze the performance of your TM1 models and identify any bottlenecks or inefficiencies. Periodically update your models to reflect changes in business processes and requirements.

6. Utilize Advanced Analytics and AI

Incorporate advanced analytics and AI capabilities to gain deeper insights from your data. Use predictive analytics to forecast future trends and identify potential risks and opportunities. TM1’s integration with other IBM tools, such as Watson, can enhance your analytics capabilities.

7. Provide Comprehensive Training

Ensure that your team is well-trained in using Planning Analytics and TM1. Comprehensive training will enable users to effectively navigate the system, create accurate reports, and perform sophisticated analyses. Consider regular training sessions to keep the team updated on new features and best practices.

8. Foster Collaboration

Encourage collaboration among different departments within your organization. Planning Analytics can serve as a central platform where various teams can share insights, discuss strategies, and make data-driven decisions. This collaborative approach can lead to more cohesive and effective planning.

9. Monitor and Maintain System Health

Regularly monitor the health of your Planning Analytics environment. Keep an eye on system performance, data accuracy, and user activity. Proactive maintenance can prevent issues before they escalate, ensuring a smooth and uninterrupted operation.

10. Seek Expert Support

Sometimes, managing Planning Analytics and TM1 can be complex and may require expert assistance. Engaging with specialized support services can provide you with the expertise needed to address specific challenges and optimize your system’s performance.

By following these tips, you can effectively manage your Planning Analytics environment and leverage the full potential of TM1 to drive better business outcomes. Remember, continuous improvement and adaptation are key to staying ahead in the ever-evolving landscape of financial planning and analytics.

For specialized TM1 support and expert guidance, consider consulting with professional service providers like Octane Software Solutions. Their expertise can help you navigate the complexities of Planning Analytics, ensuring your system is optimized for peak performance. Book me a meeting

Line

ChatGPT for Enterprise: Reimagine how works gets done with AI powered automation

Mode_Comment_Icon_black0
Alarm_Icon_15 min

In the realm of digital transformation, the concept of digital labor has emerged as a game-changer for businesses seeking efficiency, agility, and innovation. IBM WatsonsX Orchestrate, a powerhouse in the AI and data orchestration space, takes center stage in this digital evolution. This blog explores the pivotal role played by WatsonsX Orchestrate in reshaping digital labor and how it empowers organizations to harness the full potential of artificial intelligence (AI) and data science.

Orchestrate allows you to add and train new automations from a variety of sources, enabling users to easily work across existing systems using a single UI.

fiji blog (1)


Understanding Digital Labor:

Digital labor refers to the use of digital technologies, including AI, automation, and robotics, to augment or replace human tasks and processes. It's a paradigm shift in how work is done, leveraging technology to enhance productivity, reduce errors, and enable humans to focus on more strategic and creative aspects of their roles.


"Companies that effectively apply intelligent automation across the enterprise expect to outshine peers in profitability, revenue growth, and efficiency over the next 3 years."

IBM WatsonsX Orchestrate and Digital Labor:

3 points entry

  1. Workflow Automation for Operational Efficiency: One of the key pillars of digital labor is workflow automation, and WatsonsX Orchestrate excels in this domain. By automating intricate AI and data science workflows, the platform significantly reduces manual effort, streamlining processes and enhancing operational efficiency. This allows organizations to accomplish more with less, freeing up human resources for high-value tasks.

  2. Collaboration for Enhanced Productivity: Digital labor is not about replacing human workers but augmenting their capabilities. WatsonsX Orchestrate fosters collaboration among cross-functional teams, bringing together data scientists, developers, and domain experts. This collaborative environment accelerates problem-solving, decision-making, and innovation, creating a synergistic relationship between digital labor and human expertise.

  3. Scalability to Meet Growing Demands: As organizations scale their digital labor initiatives, scalability becomes a critical factor. WatsonsX Orchestrate provides the flexibility to scale horizontally and vertically, ensuring that the platform can seamlessly adapt to the growing demands of AI and data science projects. This scalability is essential for organizations aiming to expand their digital labor capabilities without compromising performance.

  4. Model Monitoring and Management for Continuous Improvement: In the era of digital labor, continuous improvement is paramount. WatsonsX Orchestrate includes robust tools for monitoring and managing AI models in production. This ensures that digital labor processes based on AI models deliver consistent and reliable results over time. The platform's capabilities contribute to the iterative refinement of digital labor processes, optimizing outcomes and enhancing overall performance.

  5. AI Explainability and Ethical Digital Labor: Transparent digital labor practices are crucial for building trust and ensuring ethical use of AI. WatsonsX Orchestrate provides tools for explaining AI model decisions, addressing the interpretability challenge often associated with complex AI systems. Additionally, the platform includes features for detecting biases, aligning digital labor practices with ethical standards and promoting fairness in decision-making.


    There are more than 2,000 activities that make up 800 full-time occupations that are part of knowledge work. However, only 5% of these full-time occupations could be fully automated using existing technology. That means that the 95% of remaining occupations require cognitive abilities.

Benefits for Businesses:

watsons business overview

  1. Accelerated Time-to-Value: By automating and streamlining AI and data science workflows, organizations can significantly reduce the time it takes to move from ideation to deployment, ultimately accelerating their time-to-value for AI initiatives.

  2. Improved Collaboration: The collaborative features of WatsonsX Orchestrate facilitate better communication and knowledge sharing among teams, leading to more effective and impactful AI solutions.

  3. Enhanced Governance and Compliance: The platform provides robust governance and compliance features, ensuring that organizations can meet regulatory requirements and maintain a high standard of data ethics.

  4. Cost-Efficiency: With the ability to scale and the flexibility of deployment options, WatsonsX Orchestrate helps organizations optimize costs by aligning infrastructure with project requirements.

In the era of AI and data-driven decision-making, IBM WatsonsX Orchestrate stands out as a powerful solution for organizations looking to harness the full potential of their AI and data science initiatives. With its automation capabilities, collaborative environment, and emphasis on ethical AI, WatsonsX Orchestrate is poised to become a key player in the journey towards building intelligent, transparent, and scalable AI solutions. As businesses continue to navigate the complexities of the digital age, platforms like WatsonsX Orchestrate provide the tools needed to turn data into a strategic asset and drive innovation in the ever-evolving landscape of AI.

Line

Saying Goodbye to Cognos TM1 10.2.x: Changes in support effective April 30, 2024

Mode_Comment_Icon_black0
Alarm_Icon_12 min

In a recent announcement, IBM unveiled changes to the Continuing Support program for Cognos TM1, impacting users of version 10.2.x. Effective April 30, 2024, Continuing Support for this version will cease to be provided. Let's delve into the details.

blog (1)

What is Continuing Support?

Continuing Support is a lifeline for users of older software versions, offering non-defect support for known issues even after the End of Support (EOS) date. It's akin to an extended warranty, ensuring users can navigate any hiccups they encounter post-EOS. However, for Cognos TM1 version 10.2.x, this safety net will be lifted come April 30, 2024.

What Does This Mean for Users?

Existing customers can continue using their current version of Cognos TM1, but they're encouraged to consider migrating to a newer iteration, specifically Planning Analytics, to maintain support coverage. While users won't be coerced into upgrading, it's essential to recognize the benefits of embracing newer versions, including enhanced performance, streamlined administration, bolstered security, and diverse deployment options like containerization.

How Can Octane Assist in the Transition?

Octane offers a myriad of services to facilitate the transition to Planning Analytics. From assessments and strategic planning to seamless execution, Octane support spans the entire spectrum of the upgrade process. Additionally, for those seeking long-term guidance, Octane  Expertise provides invaluable Support Packages on both the Development and support facets of your TM1 application.

FAQs:

  • Will I be forced to upgrade?

    No, upgrading is not mandatory. Changes are limited to the Continuing Support program, and your entitlements to Cognos TM1 remain unaffected.

  • How much does it cost to upgrade?

    As long as you have active Software Subscription and Support (S&S), there's no additional license cost for migrating to newer versions of Cognos TM1. However, this may be a good time to consider moving to the cloud. 

  • Why should I upgrade?

    Newer versions of Planning Analytics offer many advantages, from improved performance to heightened security, ensuring you stay ahead in today's dynamic business environment. This brings about unnecessary risk to your application.

  • How can Octane help me upgrade?

    Octane’s suite of services caters to every aspect of the upgrade journey, from planning to execution. Whether you need guidance on strategic decision-making or hands-on support during implementation, Octane is here to ensure a seamless transition. Plus we are currently offering a fixed-price option for you to move to the cloud. Find out more here 

In conclusion, while bidding farewell to Cognos TM1 10.2.x may seem daunting, it's also an opportunity to embrace the future with Planning Analytics. Octane stands ready to support users throughout this transition, ensuring continuity, efficiency, and security in their analytics endeavours.

Line

Top 12 Planning Analytics features that you should be using in 2023

Mode_Comment_Icon_black0
Alarm_Icon_18 min

Amin Mohammad, the IBM Planning Analytics Practice Lead at Octane Solutions, is taking you through his top 12 capabilities of Planning Analytics, in 2023. These are his personal favorites and there could be more than what he is covering.

Top 12 picks of Planning Analytics

He has decided to divide his list into PAFe and PAW, as they have their own unique capabilities, and to highlight them separately. 

Planning Analytics for Excel (PAfE)

1. Support for alternate hierarchies in TM1 Web and PAfE

Starting with TM1 Set function, which has finally opened the option to use alternate hierarchies in TM1 web. it contains nine arguments as opposed to the four in SubNM adding to its flexibility. It also supports MDX expressions as one of the arguments. This function can be used as a good replacement for SubNM.

2. Updated look for cube viewer and set editor

The Planning Analytics Workspace and Cognos Analytics have taken the extra step to provide a consistent user experience. This includes the incorporation of the Carbon Design Principles, which have been implemented in the Set Editor and cube viewer n PaFe. This allows users to enjoy an enhanced look and feel of certain components within the software, as well as improved capabilities. This is an excellent addition that makes the most out of the user experience.

3. Creating User Define Calculations (UDC)

Hands down, the User Defined Calculations is by far the most impressive capability added recently. This capability allows you to create custom calculations using the Define calc function in PAFe, which also works in TM1 Web. With this, you can easily perform various calculations such as consolidating data based on a few selected elements, performing arithmetic calculations on your data, etc. Before this capability, we had to create custom consolidation elements in the dimension itself to achieve these results in PAfE, leading to multiple consolidated elements within the dimension, making it very convoluted. Tthe only downside is that it can be a bit technical for some users who use this, making it a barrier to mass adoption. Additionally, the sCalcMun argument within this function is case-sensitive, so bear that in mind. Hoping this issue is fixed in future releases.

4. Version Control utility

The Version Control utility helps to validate whether the version of Pathway you are using is compatible with the data source version of Planning Analytics Logo. If the two versions are not compatible, you cannot use Pathway until you update the software. The Version Control uses three capability or compatibility types to highlight the status of the compatibility:

  • normal
  • warning
  • blocked

Administrators can also configure the Version Control to download a specific version of Pathway when the update button is clicked, helping to ensure the right version of Pathway is used across your organization.

Planning Analytics Workspace (PAW)

5. Single Cell widget

Planning Analytics Workspace has recently added the Single Cell widget as a visualization, making it easier to update dimension filters. Before this, the Single Cell widget could be added by right-clicking a particular data point, but it had its limitations. 

One limitation that has been addressed is the inability to update dimension filters in the canvas once the widget has been added. In order to update it, one has to redo all steps, but the single widget visualization has changed this. Now, users can change the filters and the widget will update the data accordingly. This has been a great improvement as far as enhancing user experience goes.

Additionally, the widget can be transformed into any other visualization and vice versa. When adding the widget, the data point that was selected at that point is reflected in it. If nothing is selected, the top left of the first data point in the view is used to create the widget.Single cell widget


6. Sending email notifications to Contributors

You can now easily send email notifications to contributors with the click of a button from the Contribution Panel of the Overview Report. When you click the button, it sends out an email to the members of the group that has been assigned the task. The email option is only activated when the status is either pending approval or pending submission. Clicking the icon will send the email to all the members assigned to the group for the task.Email notification to contributors

7. Add task dependencies

Now, you can add task dependencies to plans, which allows you to control the order in which tasks can be completed. For example, if there are two tasks and Task Two is dependent on Task One, Task Two cannot be opened until Task One is completed. This feature forces users to do the right thing by opening the relevant task and prevents other tasks from being opened until the prerequisite task is completed. This way, users are forced to follow the workflow and proceed in the right order.

8. Approval and Rejections in Plans with email notifications

The email notifications meintioned here are not manually triggered like the ones in the 6th top picks. These emails are fully automated and event-based. The events that trigger these emails could be opening a plan step, submitting a step, or approving or rejecting a step. The emails that are sent out will have a link taking the user directly to the plan step in question, making the planning process easier for the users to follow.

light bulb

"The worklow capabilities of the Planning Analytics Workspace have seen immense improvements over time. It initially served as a framework to establish workflows, however, now it has become a fully matured workflow component with many added capabilities. This allows for a more robust and comprehensive environment for users, making it easier to complete tasks."

9. URL to access the PAW folder

PAW (Planning Analytics Workspace) now offers the capability to share links to a folder within the workspace. This applies to all folders, including the Personal, Favorites, and Recent tabs. This is great because it makes it easier for users to share information, and also makes the navigation process simpler. All around, this is a good addition and definitely makes life easier for the users.

10. Email books or views

The administrator can now configure the system to send emails containing books or views from Planning Analytics Workspace. Previously, the only way to share books or views was to export them into certain formats. However, by enabling the email functionality, users are now able to send books or views through email. Once configured, an 'email' tab will become available when viewing a book, allowing users to quickly and easily share their content. This option was not previously available.

11. Upload files to PA database​

Workspace now allows you to upload files to the Planning Analytics database. This can be done manually using the File Manager, which is found in the Workbench, or through a TI process. IBM has come up with a new property within the action button that enables you to upload the file when running the TI process. Once the file is uploaded, it can be used in the TI process to load data into TM1. This way, users do not have to save the file in a shared location and can simply upload it from their local desktop and load the data. This is a handy new functionality that IBM has added. Bear in mind that the file cannot be run until it has been successfully uploaded, so if the file is large, it may take time.

12. Custom themes​

Finally, improvements in custom themes. Having the ability to create your own custom themes is incredibly helpful in order to align the coloring of your reports to match your corporate design. This removes the limitation of only being able to use pre-built colors and themes, and instead allows you to customize it to your specific requirements. This gives you the direct functionality needed to make it feel like your own website when any user opens it.

That's all I have for now. I hope you found these capabilities insightful and worth exploring further.

If you want to see the full details of this blogpost. Click here

Line

Planning Analytics Audit log – Little known pitfall

Mode_Comment_Icon_black0
Alarm_Icon_12 min

The blogs brief about the challenge faced post enabling the Audit log in one of our client's environment. Once the audit log was turned on to capture the metadata changes, the Data Directory backup scheduled process started to fail.

After some investigation, I found the cause was the temp file (i.e., tm1rawstore.<TimeStamp> ) generated by the audit log by default and placed in the data directory.

The Temp file is used by audit log to record the events before moving it to a permanent file (i.e., tm1auditstore<TimeStamp>). Sometimes, you may even notice dimension related files (i.e., DimensionName.dim.<Timestamp>), and these files are generated by audit log to capture the dimension related changes.

The RawStoreDirectory is a tm1.cfg parameter related to the audit log, which helped us resolve the issue. This parameter is used to define the folder path for temporary, unprocessed log files specific to the audit log, i.e., tm1rawstore.<TimeStamp>, DimensionName.dim.<Timestamp>. If this Config is not set, then by default, these files get placed in Data Directory.

RawStoreDirectory = <Folderpath>


Now, let's also see other config parameters related to the audit logs


AuditLogMaxFileSize:

The config parameter can be used to control the maximum size audit log file to be before the file gets saved and a new file is created. The unit needs to be appended at the end of the value defined ( KB, MB, GB), and Minimum is 1KB and Maximum is 2GB; if this is not specified in the TM1 Cfg then the default value would be 100 MB.

AuditLogMaxFileSize=100 MB


AuditLogMaxQueryMemory:

The config parameter can be used to control maximum memory the TM1 server can use for running audit log query and retrieving the set. The unit needs to be appended at the end of the value defined ( KB, MB, GB) and Minimum is 1KB and Maximum is 2GB; if this is not specified in the TM1 Cfg then the default value would be 100 MB.

AuditLogMaxQueryMemory=200 MB


AuditLogUpdateInterval:

The config parameter can be used to control the amount of time the TM1 server needs to wait before moving the contents from temporary files to a final audit log file. The value is taken in minutes; that is, say 100 is entered, then it is taken has 100 minutes.

AuditLogUpdateInterval=100


That's it folks, hope you had learnt something new from this blog.

Line

Planning Analytics Administration: An Alert (Proactive Mechanism)

Mode_Comment_Icon_black0
Alarm_Icon_13 min

Gone days, where we had no control/alerts mechanism on the TM1 database, CPU/memory it consumes, react at the nick of the moment before TM1 server crashes.

I am sure all TM1 lovers, administrators and business users who had these experiences in the past would connect to what I am referring to. For all new Planning Analytics users, in earlier versions of TM1/ Planning Analytics, we had little overview on how much on RAM/ memory can a TM1 instance use/utilize or have an inbuilt alter mechanism. 

TM1 Database Alert Mechanism: 

Issue: 

Most of you know, TM1 Server loves memory/RAM, more memory available the better performance/processing you get. Due to the trade-off between the cost and memory availability, there has always been a cap on upper limit on RAM available to TM1 Server.   

What is new: 

We now have an inbuilt mechanism in Planning Analytics Workspace, wherein we can set certain configuration and look for alters at a different level.  

Administrators can now set, database threshold and alter configurations in a single tab on the Database settings page for the individual database in Planning Analytics Administration. 

Isn’t that the good news! To use this, Planning Analytics Workspace version must be 2.0.46 or higher. In the previous version of Planning Analytics Administration, it was not possible to apply unique settings for each database, thresholds and alerts were set on separate tabs of a configuration page, but settings were applied to all databases in the environment. 

Navigation

For database settings, go to the Administration page, click Database as shown below. 

Screen Shot 2020-03-04 at 11.28.18 am

Click on settings (highlighted), Database Setting, move to Thresholds and alerts. 

The administrator can enter values for Warning threshold and Critical threshold and enable alert as different resource usages, as shown below. 


Screen Shot 2020-03-04 at 11.28.24 am


The administrator can also set thread auto-refresh time interval. 

Screen Shot 2020-03-04 at 11.28.37 am


Wonderful, now you can implement these in your environment, any doubts – we are here to help you for sure! Contact us today to find out how we can help you leverage your data for true business intelligence. 


You may also like reading “ Predictive & Prescriptive-Analytics ” , “ Business-intelligence vs Business-Analytics ” ,“ What is IBM Planning Analytics Local ” , “IBM TM1 10.2 vs IBM Planning Analytics”, “Little known TM1 Feature - Ad hoc Consolidations”, “IBM PA Workspace Installation & Benefits for Windows 2016”. 


Octane Software Solutions Pty Ltd is an IBM Registered Business Partner specialising in Corporate Performance Management and Business Intelligence. We provide our clients with advice on best practices and help scale up applications to optimise their return on investment. Our key services include Consulting, Delivery, Support and Training. Octane has its head office in Sydney, Australia as well as offices in Canberra, Bangalore, Gurgaon, Mumbai, and Hyderabad. 


Line

Planning Analytics for Excel: Trace TI status

Mode_Comment_Icon_black0
Alarm_Icon_12 min

IBM has been recommending its users to move to Planning Analytics for Excel (PAX) from TM1 Perspective and/or from TM1 Web. This blog is dedicated to clients who have either recently adopted PAX or contemplating too and sharing steps on how to trace/watch TI process status while running process using Planning Analytics for Excel.

Steps below should be followed to run processes and to check TI process status.

1. Once you connect to Planning Analytics for Excel, you will be able to see cubes on the right-hand side, else you may need to click on Task Pane.

 
pax1


2. Click on the middle icon as shown below and click on Show process. This will help show all process (to which respective user has access to) in Task Pane.

 
pax2


3. You will now be able to see Process.


pax3


4. To check/ trace status of the process (when triggered via Planning analytics for excel) right-Click on Processes and click Active processes.


pax4


5. A new box will pop-up as shown below.

 
pax5


6. You can now run process from Task pane and check if you can track status in new box popped up in step 5.


pax6


7. You can now see the status of process in this box, below is a screen print that shows the for-process cub.price.load.data, process completed 4 tasks out of 5 tasks.

pax7


8. Below screen prints tells us if the status of TI process, they are Working , Completed and Process completed with Errors.

pax8


Once done, your should be able to to trace TI status in Planning Analytics for Excel. Happy Transitioning.

As I pen down my last Blog for 2019, wishing you and your dear ones a prosperous and healthy 2020.

Until next time....keep planning & executing.


Line

IBM Planning Analytics Secure Gateway Client: Steps to Set-Up

Mode_Comment_Icon_black0
Alarm_Icon_17 min

This blog broaches all steps on how to install IBM Secure Gateway Client.

IBM Secure Gateway Client installation is one of the crucial steps towards setting up secure gateway connection between Planning Analytics Workspace (On-Cloud) and RDBMS (relational database) on-premise or on-cloud.

Picture1-22-1

What is IBM Secure Gateway :

IBM Secure Gateway for IBM Cloud service provides a quick, easy, and secure solution establishing a link between Planning Analytics on cloud and a data source. Data source can reside on an “on-premise” network or on “cloud”. Data sources like RDBMS, for example IBM DB2, Oracle database, SQL server, Teradata etc.

Secure and Persistent Connection :

A Secure Gateway, useful in importing data into TM1 and drill through capability, must be created using TurboIntegrator to access RDBMS data sources on-premise.

By deploying the light-weight and natively installed Secure Gateway Client, a secure, persistent and seamless connection can be established between your on-premises data environment and cloud.

The Process:

This is two-step process,

  1. Create Data source connection in Planning Analytics Workspace.
  2. Download and Install IBM Secure Gateway

To download IBM Secure Gateway Client.

  1. Login to Workspace ( On-Cloud)
  2. Navigate to Administrator -> Secure Gate

Picture2-5

Click on icon as shown below, this will prompt a pop up. One needs to select operating system and follow steps to install the client.
Picture3-3

Once you click, a new pop-up with come up where you are required to select the operating system where you want to install this client.

Picture4-2

Choose the appropriate option and click download.

If the download is defaulted to download folders you will find the software in Download folder like below.

Picture5-2

Installation IBM Secure Gateway Client:

To Install this tool, right click and run as administrator.

Picture6-2


Keep the default settings for Destination folder and Language, unless you need to modify.

Picture7-1

Check box below if you want this as Window Service.

Picture8-2

Now this is an important step, we are required to enter Gateway ids and security tokens to establish a secured connection. These needs to be copied over from Secure connection created earlier in Planning Analytics Workspace ( refer 1. Create Data source connection in workspace).

Picture9-2

Figure below illustrates Workspace, shared details on Gateway ID and Security Token, these needs to be copied and pasted in Secure Gateway Client (refer above illustration).

Picture10-1

If user chooses to launch the client with connection to multiple gateways, one needs to take care while providing the configuration values.

  1. The gateway ids need to be separated by spaces.
  2. The security tokens, acl files and log levels should to be delimited by --.
  3. If you don't want to provide any of these three values for a particular gateway, please use 'none'.
  4. If you want Client UI you may choose else select No.

Note: Please ensure that there are no residual white spaces.

Picture11-3

Now click Install, once this installation completes successfully, the IBM Secure Gateway Client is ready for use.

This Connection is now ready, Planning Analytics can now connect to data source residing on-premise or any other cloud infrastructure where IBM Secure Gateway client is installed.


You may also like reading “ Predictive & Prescriptive-Analytics ” , “ Business-intelligence vs Business-Analytics ” ,“ What is IBM Planning Analytics Local ” , “IBM TM1 10.2 vs IBM Planning Analytics”, “Little known TM1 Feature - Ad hoc Consolidations”, “IBM PA Workspace Installation & Benefits for Windows 2016”.

Line

What is IBM Watson™ Studio?

Mode_Comment_Icon_black0
Alarm_Icon_11 min

IBM Watson™ Studio is a platform for businesses to prepare and analyse data as well as build and train AI and machine learning models in a flexible hybrid cloud environment.

IBM Watson™ Studio enables your data scientists, application developers and subject matter experts work together easier and collaborate with the wider business, to deliver faster insights in a governed way.

Watch the below for another brief intro


Available in on the desktop which contains the most popular portions of Watson Studio Cloud to your Microsoft Windows or Apple Mac PC with IBM SPSS® Modeler, notebooks and IBM Data Refinery all within a single instal to bring you comprehensive and scalable data analysis and modelling abilities.

However, for the enterprise, there are also the versions of Watson Studio Local, which is a version of the software to be deployed on-premises inside the firewall, as well as Watson Studio Cloud is part of the IBM Cloud™, a public cloud platform. No matter which version your business may use you can start using Watson Studio Cloud and download a trial of the desktop version today!

Over the next 5 days, we'll ensure to send you use-cases and materials of worth for you to review at your earliest convenience. Be sure to check our social media pages for these.

Line

IBM Planning Analytics (TM1) Vs Anaplan

Mode_Comment_Icon_black0
Alarm_Icon_14 min

Picture15-1

IBM Planning Analytics (TM1) vs Anaplan

There has been a lot of chatter lately around IBM Planning Analytics (powered by TM1) vs Anaplan. Anaplan is a relatively new player in the market and has recently listed on NYSE. Reported Revenue in 2019 of USD 240.6M (interestingly also reported an operating loss of USD 128.3M). Compared to IBM which has a 2018 revenue of USD 79.5 Billion (there is no clear information on how much of this was from the Analytics area) with a net profit of 8.7 b). The size of global Enterprise Performance Management (EPM) is around 3.9 Billion and expected to grow to 6.0Billion by 2022. The size of spreadsheet based processes is a whopping 60 Billion (Source: IDC)

Anaplan has been borne out of the old Adaytum Planning application that was acquired by Cognos and Cognos was acquired by IBM in 2007. Anaplan also spent 176M on Sales and Marketing so most people in the industry would have heard of it or come across some form of its marketing. (Source: Anaplan.com)

I’ve decided to have a closer look at some of the crucial features and functionalities and assess how it really stacks up.

Scalability 

There are some issues around scaling up the Anaplan cubes where large datasets are under consideration (8 billion cell limit? While this sounds big, most of our clients reach this scale fairly quickly with medium complexity). With IBM Planning Analytics (TM1) there is no need to break up a cube into smaller cubes to meet data limits. Also, there is no demand to combine dimensions to a single dimension. Cubes are generally developed with business requirements in mind and not system limitations. Thereby offering superior degrees of freedom to business analyst.

For example, if enterprise wide reporting was the requirement, then the cubes may be need to be broken via a logical dimension like region of divisions. This in turn would make consolidated reporting laborious, making data slicing and dicing difficult, almost impossible.


Picture14-1-1  


Excel Interface & Integration

Love it or hate it – Excel is the tool of choice for most analyst and finance professionals. I reckon it is unwise to offer a BI tool in today’s world without a proper excel integration.  I find Planning Analytics (TM1) users love the ability to use excel interface to slice and dice, drill up and down hierarchies and drill to data source. The ability to create interactive excel reports with ability to have cell by cell control of data and formatting is a sure-shot deal clincher.

On the other hand, on exploration realized Anaplan offers very limited Excel support.

 Picture11-2Picture12-1


 Analysis & Reporting

In today’s world users have come to expect drag and drop analysis. Ability to drill down, build and analyze alternate view of the hierarchy etc “real-time”. However, if each of this query requires data to be moved around cubes and/or requires building separate cubes then it’s counterproductive. This would also increase the maintenance and data storage overheads. You also lose sight of single source of truth as your start developing multiple cubes with same data just stored in different form. This is the case with Anaplan due to the software’s intrinsic limitations.

Anaplan also requires users to invest on separate reporting layer as it lacks native reporting, dashboards and data visualizations.

This in turn results in,

  1. Increase Cost
  2. Increase Risk
  3. Increase Complexity
  4. Limited planning due to data limitations

IBM Planning Analytics, on the contrary offers out of the box ability to view & analyze all your product attributes and the ability to slice and dice via any of the attributes. 

It also comes with a rich reporting, dashboard and data visualization layer called Workspace. Planning Analytics Workspace delivers a self-service web authoring to all users. Through the Planning Analytics Workspace interface, authors have access to many visual options designed to help improve financial input templates and reports. Planning Analytics Workspace benefits include:

  1. Free-form canvas dashboard design
  2. Data entry and analysis efficiency and convenience features
  3. Capability to combine cube views, web sheets, text, images, videos, and charts
  4. Synchronised navigation for guiding consumers through an analytical story
  5. Browser and mobile operation
  6. Capability to export to PowerPoint or PDF

Picture13-1

Source : Planning Analytics (TM1) cube

Line

Planning Analytics - Cloud Or On-Premise

Mode_Comment_Icon_black0
Alarm_Icon_14 min

cloudsaas-1

This Blog details IBM Planning Analytics On-Cloud and On-Premise deployment options. It focusses & highlights key points which should help you make the decision; “whether to adopt Cloud Or stay on Premise”


IBM Planning Analytics:

As part of their continuous endeavour to improve application interface and better customer experience, IBM rebranded TM1 to Planning Analytics couple of years back which came with many new features and a completely new interface. With this release (PA 2.x version as it has been called), IBM is letting clients choose Planning Analytics as Local SW or as Software as a Service (SaaS) deployed on IBM Softlayer Cloud.

cloud-vs-on-premise-1280x720-1

Planning Analytics on Cloud:

Under this offering, Planning Analytics system operates in a remote hosted environment. Clients who choose Planning Analytics deployed “on-cloud” can reap many benefits aligned to any typical SaaS.

With this subscription, Clients’ need not worry about software Installation, versions, patches, upgrades, fixes, disaster recovery, hardware etc.

They can focus on building business models and enriching data from different source systems and give meaning to the data they have. This by converting data into business critical, meaningful, actionable insights.

Benefits:

While not a laundry list, covers significant benefits.

  • Automatic software updates and management.
  • CAPEX Free; incorporates benefits of leasing.
  • Competitiveness; long term TCO savings.
  • Costs are predictable over time.
  • Disaster recovery; with IBM’s unparalleled global datacentre reach.
  • Does not involve additional hardware costs.
  • Environment friendly; credits towards being carbon neutral.
  • Flexibility; capacity to scale up and down.
  • Increased collaboration.
  • Security; with options of premium server instances.
  • Work from anywhere; there by driving up productivity & efficiencies.

Client must have Internet connection to use SaaS and of course, Internet speed plays major role. In present world Internet connection has become a basic necessity for all organizations.

Picture11-1

Planning Analytics Local (On-Premise):

Planning Analytics local essentially is the traditional way of getting software installed on company’s in-house server and computing infrastructure installed either in their Data Centre or Hosted elsewhere.

In an on-premise environment - Installation, upgrade, and configuration of IBM® Planning Analytics Local software components are on the Organization.

Benefits of On-Premise:

  • Full control.
  • Higher security.
  • Confidential business information remains with in Organization network.
  • Lesser vendor dependency. 
  • Easier customization.
  • Tailored to business needs.
  • Does not require Internet connectivity, unless “anywhere” access is enabled.
  • Organization has more control over implementation process.

As evident on-premise option comes with some cons as well, few are listed below.

  • Higher upfront cost
  • Long implementation period.
  • Hardware maintenance and IT cost.
  • In-house Skills management.
  • Longer application dev cycles.
  • Robust but inflexible.

On-premise software demands constant maintenance and ongoing servicing from the company’s IT department.

Organization on on-premise have full control on the software and on its related infrastructure and can perform internal and external audits as and when needed or recommended by governing/regulatory bodies.

Before making the decision, it is also important to consider many other influencing factors; from necessary security level to the potential for customization, number of Users, modelers, administrators, size of the organization, available budget, long term benefits to the Organization.

While you ponder on this, there are many clients who have adopted a “mid-way” of hybrid environment. Under which basis factors like workload economics, application evaluation & assessment, security and risk profiles, applications are being gradually moved from on-premise to cloud in a phased manned.


You may also like reading “ What is IBM Planning Analytics Local ” , “IBM TM1 10.2 vs IBM Planning Analytics”, “Little known TM1 Feature - Ad hoc Consolidations”, “IBM PA Workspace Installation & Benefits for Windows 2016”.

For more Information: To check on your existing Planning Analytics (TM1) entitlements and understand how to upgrade to Planning Analytics Workspace (PAW) reach out to us at info@octanesolutions.com.au for further assistance.

Octane Software Solutions Pty Ltd is an IBM Registered Business Partner specialising in Corporate Performance Management and Business Intelligence. We provide our clients advice on best practices and help scale up applications to optimise their return on investment. Our key services include Consulting, Delivery, Support and Training. Octane has its head office in Sydney, Australia as well as offices in Canberra, Bangalore, Gurgaon, Mumbai, and Hyderabad.

To know more about us visit, OctaneSoftwareSolutions.

Line

Predictive & Prescriptive Analytics: IBM Decision Optimisation

Mode_Comment_Icon_black0
Alarm_Icon_17 min

unnamed (2)


Predictive analytics:

Predictive analytics is the practice of extracting information from existing data sets in order to determine patterns and predict future outcomes and trends. A way to predict the future using data from the past.

Predictive analytics brings together advanced analytics capabilities spanning ad-hoc statistical analysis, predictive modelling, data mining, text analytics, optimization, real-time scoring and machine learning. These are tools that help organizations discover patterns within the data and go beyond knowing what has happened to anticipate what is probable to happen next.

  • Use historical information to determine patterns.
  • Once equipped with these patterns, predictive models are built and are used to forecast possible trends and outcomes.
  • Predictive analytics highlights approaching opportunities and potentials for risk to improve the quality of decision-making around upcoming events.


Prescriptive Analytics:

Prescriptive analytics is the use of technology to help businesses make better decisions in handling specific events by factoring in the knowledge of possible constraints, available resources, past performance and current situation.

Prescriptive analytics involves mathematical and computational algorithms and goes beyond predicting future outcomes by also suggesting actions and to benefit from the predictions and showing the implications of each decision option.

Prescriptive analytics seeks to determine the optimized solution or best outcome among different choices depending on current constraints, resources and priorities. Prescriptive analytics uses both descriptive and predictive data to determine a specific action to take.

Prescriptive Analytics capabilities :

Prescriptive Analytics hold below features

  • Prescriptive Modelling
  • Uses mathematical and computations models
  • Optimized solutions
  • Continually take in new data to re-predict and re-prescribe
  • Automatically improve prediction accuracy and prescribing better decision options
  • Visualization
  • Prescriptive analytics incorporates both structured and unstructured data


k 

IBM Decision Optimisation is one such solution from IBM.


IBM Decision Optimisation:

IBM Decision Optimisation is a prescriptive analytics solution that enables organisations in commerce, manufacturing, financial services, healthcare, telco, government and other highly data-intensive industries to make better decisions and achieve business goals by solving complex optimisation problems.

IBM Decision Optimisation solves business problems using Mathematical and Constraint programming.

IBM Decision Optimisation solutions provide features that help create optimization models, either using general programming language APIs, like Python, Java or OPL to solve the breadth of optimization models, using proven and powerful optimization engines.


unnamed (4) 

IBM Decision Optimisation is an integral part of IBM Watson® Studio, so users can benefit from all data science features of IBM Watson Studio, like access to machine-learning models, the ability to pass output from predictive analytics to the Decision Optimisation engine, access to open notebook features, visualization features and data connectivity options from IBM Watson Studio.


unnamed (3) 

Key benefits

  • Powerful optimization engines for faster performance
  • Quickly build optimization models using your preferred language
  • Access to more data science features


Register for our webinar 'Business Decisions and Resource Allocation' to learn how IBM Planning Analytics with Watson and IBMLOG CPLEX work seamlessly together. 


IBM Case Study:

Client:

Leading bulk tanker transportation company.

Business challenge:

To transport bulk products safely and profitably, this carrier needs to manage hundreds of constraints on tankers, drivers and cargos. How can it help its planners make optimal routing decisions?

Transformation:

This leading bulk carrier embedded IBM optimization software into its operational systems and developed a sophisticated solution that provides insight to optimize driver and route planning every 10 minutes

Results:

Millions of dollars saved annually by eliminating miles of unnecessary driving.

Millions more dollars saved annually by improving driver retention.

Million-dollar revenue boost achieved by increasing driver productivity.

Click here for more details.


Products

  • IBM ILOG® CPLEX® Optimization Studio
  • IBM Decision Optimization for Watson Studio
  • IBM Decision Optimization Center
  • IBM Decision Optimization on Cloud
  • IBM ILOG CPLEX Optimizer for z/OS


Organizational Benefits:

  • Optimized solutions to solve business problems.
  • Greater ease-of-use.
  • Comprehensive analytics capabilities
  • Movement to the cloud
  • Increased adoption beyond financial services
  • Overall market growth.
  • Open source integration
  • A flexible and scalable platform for one-to-many analytics.

Hope you have enjoyed reading this blog as much as I had testing this cool feature; stay tuned for upcoming blogs.

 You may also like reading “What is IBM Planning Analytics Local ”, “IBM TM1 10.2 vs IBM Planning Analytics”, “Little known TM1 Feature - Ad hoc Consolidations”, “IBM PA Workspace Installation & Benefits for Windows 2016”.

For more information: To check on your existing Planning Analytics (TM1) entitlements and understand how to upgrade to Planning Analytics Workspace (PAW) reach out to us at info@octanesolutions.com.au for further assistance.

Octane Software Solutions Pty Ltd is an IBM Registered Business Partner specialising in Corporate Performance Management and Business Intelligence. We provide our clients with advice on best practices and help scale up applications to optimise their return on investment. Our key services include Consulting, Delivery, Support and Training.

Octane has its head office in Sydney, Australia as well as offices in Canberra, Bangalore, Gurgaon, Mumbai, and Hyderabad.

To know more about us visit, OctaneSoftwareSolutions.


Line

Business Intelligence – Business Analytics

Mode_Comment_Icon_black0
Alarm_Icon_18 min

unnamed (1)


This article talks about Business Intelligence and Business Analytics, things in common and about differences between one another. This blog also talks about the paybacks for an organization once these are adopted.

Let’s  start ... Though Business Intelligence and Business Analytics sound similar and are being used interchangeably by many, they do have differences.


Business Intelligence ( BI ) :-

Term Business Intelligence, though exist for long, have been used by wider audience from late 90s .

Intelligence with in Business comes from the data being captured. Business Intelligence has been considered as a process to collect, store, maintain, retrieve and interpret data and purpose is to optimize, streamline and smoothen current operations within the Organization. BI helps in making better-informed decisions, improve performance, helps in creating new strategic opportunities for growth, eventually helps to better understand how the business is doing, make better-informed decisions.

In bullet points, BI is:

  • A process deals with collecting data, querying, reporting, online analytical processing and alerting.
  • The purpose of business intelligence is to support data-driven business decision making.
  • BI solutions collect and analyse current and historical, actionable data with the purpose of providing insights into improving business operations.
  • Improves and maintains operational efficiency and helps companies increase organizational productivity.
  • BI is more concerned with the WHATs and the HOWs(Performance).
  • BI Technologies are efficient enough to give insight on what happened in the past / is happening right now in business –If input data to BI systems is real and granular, Organisations would have a much better insight.
  • BI refers to set of technologies(DSS) supporting decision-making process by executives, middle management.  
  • A dashboard gives all required insight needed, also displays data trend – thus helps management in taking right decision at right time to run the businesses effectively.
  • BI tools have evolved to become much more intuitive and user-friendly.


6


Business Intelligence gives information about the data itself and also provides insights rather than making extra transformations or conversions.

Business Analytics :-

Word, Business Analytics was also in existence for long but became a buzz word in last 10-15 years. Business Analytics is process of exploring data and interpreting data.

  • Uses Statistical analysis and predictive modelling
  • Business Analytics involves multiple technologies to transforming raw form of data into a meaningful way to convey the solution in best way possible.
  • Analyses past data to drive current business and predict future business. Supports management in decision making to change existing business operations and improve productivity.
  • Helps management in improving future business operations using current and history data, thus boosting future performance.
  • Uses past data to extract insight, drive customer needs and increasing productivity.
  • Establishes trends and helps analyse WHY things are happening and provide optimized solutions to solve problem.
  • Applies to companies where future growth and productivity is one of their goal.
  • Helps in answering WHAT and WHY and also HOW to achieve.


k


Business Intelligence and Business Analytics:-


Mutual:

  • Collects raw data, current and historical data. Transforms raw data into meaningful data.
  • Analyses data, helps in identifying pain points, provides alternatives, suggests optimized solutions.
  • Data mining helps in finding insights from existing data .
  • Rich visualization provides Dashboards.
  • Dashboards can be a single point to know how Organization is performing, Areas to focus, historical data visualization and many more.
  • Multiple technologies involved.


Focus:

  • Business Intelligence focuses on past and current data, Business Analytics also uses past and current data but helps in predicting future trend using existing data.
    • Business Intelligence Visualization helps with past and present trend to some extent predict future for the Business Model.
    • Business Intelligence uses traditional approach, Business Analytics uses Statistical methods and models.
    • Business Analytics though have reporting capability but primarily makes predictions using collected data and offers optimized solutions.
  • Business Intelligence focuses on Descriptive and Diagnostic Analytics, Business Analytics is more about Predictive Analytics and Prescriptive Analytics.


n


Both Business Intelligence and Business Analytics share activities with in above figure.


Organizational Benefits:

Business Intelligence and Business Analytics helps organization in meeting their  Strategic Goals , near-term , long-term goals. These systems provide insights from raw data feed initially to a digestible and understandable information to the Executive management.

Business Intelligence helps giving insight with in Business Models, Analytics focuses on Business process and gives optimized solutions and thus helps decision making.

These systems provide details on business performance, help them answer many questions, some listed below.

    • How business is performing.
      • Current state
      • When compared to last year, last quarter, last five years etc .
      • Where is it performing well?
      • Where is it not performing well?
      • What happened?
      • Why is it not performing well ?
      • Why not ?
      • What happened?
      • What now?
      • Are we missing Goals, what/How and who, what change needed etc
    • What needs to be done ?
    • What should change ?


gj


Business Users like, Executive Team, Middle management, Business Analyst can always do ad hoc analysis, ad hoc reporting and predict the impact of change to expected outcomes. Thus, helps management in taking decisions to meet Organizational objects, goals and targets.

Hope you would have enjoyed reading this blog as much as I had testing this cool feature; stay tuned for upcoming blogs.

You may also like reading “ What is IBM Planning Analytics Local ” , “IBM TM1 10.2 vs IBM Planning Analytics”, “Little known TM1 Feature - Ad hoc Consolidations”, “IBM PA Workspace Installation & Benefits for Windows 2016”. 

For more Information: To check on your existing Planning Analytics (TM1) entitlements and understand how to upgrade to Planning Analytics Workspace (PAW) reach out to us at info@octanesolutions.com.au for further assistance.

Octane Software Solutions Pty Ltd is an IBM Registered Business Partner specialising in Corporate Performance Management and Business Intelligence. We provide our clients advice on best practices and help scale up applications to optimise their return on investment. Our key services include Consulting, Delivery, Support and Training.

Octane has its head office in Sydney, Australia as well as offices in Canberra, Bangalore, Gurgaon, Mumbai, and Hyderabad.

To know more about us visit, OctaneSoftwareSolutions.


Line

Is Your Data Good Enough for Business Intelligence Decisions?

Mode_Comment_Icon_black0
Alarm_Icon_13 min

business-intelligence-1

There’s no question that more and more enterprises are employing analytics tools to help in their strategic business intelligence decisions. But there’s a problem - not all source data is of a high quality.

Poor-quality data likely can’t be validated and labelled, and more importantly, organisations can’t derive any actionable, reliable insights from it.

So how can you be confident your source data is not only accurate, but able to inform your business intelligence decisions? It starts with high-quality software.


Finding the right software for business intelligence

There are numerous business intelligence services on the market, but many enterprises are finding value in IBM solutions. 

IBM’s TM1 couches the power of an enterprise database in the familiar environment of an Excel-style spreadsheet. This means adoption is quick and easy, while still offering you budgeting, forecasting and financial-planning tools with complete control.

Beyond the TM1, IBM Planning Analytics takes business intelligence to the next level. The Software-as-a-Service solution gives you the power of a self-service model, while delivering data governance and reporting you can trust. It’s a robust cloud solution that is both agile while offering foresight through predictive analytics powered by IBM’s Watson.


business-intelligence-3-1-1


Data is only one part of the equation

But it takes more than just the data itself to make the right decisions. The data should help you make smarter decisions faster, while your business intelligence solution should make analysing the data easier. 

So how do you ensure top-notch data? Consider these elements of quality data:

  • Completeness: Missing data values aren’t uncommon in most organisations’ systems, but you can’t have a high-quality database where the business-critical information is missing.
  • Standard format: Is there a consistent structure across the data – e.g. dates in a standard format – so the information can be shared and understood?
  • Accuracy: The data must be free of typos and decimal-point errors, be up to date, and be accurate to the expected ‘real-world’ values.
  • Timeliness: Is the data ready whenever it’s needed? Any delays can have major repercussions for decision-making.
  • Consistent: Data that’s recorded across various systems should be identical. Inconsistent datasets – for example, a customer flagged as inactive in one system but active in another – degrades the quality of information.
  • Integrity: Is all the data connected and valid? If connections are broken, for example if there’s sales data but no customer attached to it, then that raises the risk of duplicating data because related records are unable to be linked.

Are you looking to harness the power of your source data to make actionable business decisions? Contact Octane to find out how we can help you leverage your data for true business intelligence.


business-intelligence-2-1-1


Line

Self Service: How Big Data Analytics is Empowering Users

Mode_Comment_Icon_black0
Alarm_Icon_13 min

big-data-analytics-1


Smart businesses are seeking out new ways to leverage the benefits of their big data analytics programs, and the self-service model is coming up trumps. By placing the onus directly on business users, enterprises are empowering customers with insights-driven dashboards, reports, and more. But it’s not the only bonus. 

Arguably an even greater upside for organisations is that it alleviates the talent shortage that often comes with big data. With most companies only employing a handful of data experts who can deliver analytics insights to customers, the self-service model means they are freed up to concentrate on more important tasks, while allowing the masses to derive their own insights on their own terms. 


What are the real benefits of self service?

If nothing else, a self-service model creates a ‘democratisation’ of big data, giving users the freedom to access the data they need when they need it most: during the decision-making process.

Moreover, there’s a low cost to entry – coupled with reduced expenses thanks to freeing up data science and IT resources – and faster time to insight. When users know what they need and can change their research strategies according to new and changing demands, they become more empowered.

But it’s not all smooth sailing – giving customers the tools they need for self service is only one part of the equation. They must also be educated on the potential pitfalls.


big-data-analytics-2-1


Avoid the common hurdles

When several users have access to specific data, there’s a risk of multiple copies being made over time, thus compromising the ‘one version of truth’ and possibly damaging any insights that could be derived.

Business users unfamiliar with big data analytics are also prone to mistakes, as they may be unaware of data-preparation complexities – not to mention their own behavioural biases. 

For all these issues, however, education is the solution, which is what Ancestry.com focused on when it began encouraging self-service analytics through its new data-visualisation platform. And with 51 quintillion cells of data you can see why.


There’s no harm in starting small with big data analytics

Ancestry.com has over 10 billion historical records and about 10 million registered DNA participants, according to Jose Balitactac who is the FP&A Application Manager.

The old application they were using was taking hours to do the calculations.  They looked at seven different applications before deciding on IBM Planning Analytics.  

The reason they chose IBM Planning Analytics was to accommodate the company’s super-cube of data, other solutions would have required them to “break it into smaller cubes, or reduce the number of dimensions, or join members, such as business units and cost centers.” They didn’t want to do that because their processes worked.

They set up a test with IBM to time how long it took for the model to calculate and it took less than 10-20 seconds which is what they wanted. You can read more about the Ancestry.com case study here.

If you’re keen to empower your business users through a self-service model, contact Octane today to learn how we can help you harness big data analytics.


big-data-analytics-3-1-1


Line

Planning Analytics and PowerBI

Mode_Comment_Icon_black6
Alarm_Icon_12 min
Many businesses have already turned to Octane and partnered with us to help turn their data into meaningful insights. So if you've wanted to connect your Planning Analytics to Power BI, you're not alone and now with us you can.
 
Octane has developed a way you can work directly with IBM Planning Analytics (powered by TM1) and Microsoft Power BI! We've had a number of clients who have wanted to integrate Planning Analytics and Power BI without using external proprietary software we at Octane can say that we've answered the market's call.
 
Planning Analytics powered by TM1 is one of the worlds most popular tools for data consolidations and forecasting whilst PowerBI is one of the most popular data visualsation tools and now Octane can provide you a One-stop solution which includes the data import from tm1 with metadata information about the data hierarchy.
 
Gone is the need for writing TI processes to create a csv file output, then read the csv file and load the data into PowerBI or any number of other permutations that require several more steps/operations which is time consuming and costly to your business. 
 
With the power of a Restful API solution Octane Software Solution will connect TM1 and PowerBI. See how simple it is!
 
Contact bidesh.pal@ocatnesolutions.com.au for a commitment free demo today. 


New call-to-action


Line

IBM Cloud Private for Data is AMAZING!

Mode_Comment_Icon_black0
Alarm_Icon_13 min
Yesterday I was fortunate to attend an IBM partner day based on IBM Cloud Private for Data or ICPD and thought to write this blog for you who might not know what the platform is or does. 
 
Integrated-data-platform
 
This platform balances the individual data needs of your business by providing an integrated self-service, agile, enterprise-ready platform to significantly improve the governance around the collection, organisation, dissemination and analysis of your data but this isn't the best part. ICPD utilises modern microservices applications to enhance your data assets and analysis with machine learning (ML) and artificial intelligence (AI).
 
Built on the foundation of IBM Cloud Private, ICPD is an integrated end-to-end platform designed to help make data more accessible and trusted across your organisation. Further, the platform facilitates the inventory and cataloguing of data sources, the platform then provides further access to many analytical tools to gain insights from your data then easily share, request and approve access, otherwise governing this across the enterprise.
 
With this level of governance, transparency and armed with insights from data the platform then facilitates the fast development, training and deployment of ML and AI models. Personally having worked through these models yesterday and well into the night I was blown away with the capabilities of the ICPD platform.
 
The result of the aforementioned and what I think everyone should pay attention to is that this is a single platform to achieve what many enterprises set out to do. That is to provide high quality; trusted data that can be more easily prepared, collated, secure, analysed and disseminated all in a single integrated platform.
 
But how can this all be managed you ask? Well it can be managed internally or by a third party. It can be hosted on-premise or externally on the cloud with many options to customise the experience and the requirements you have to fulfill your unique needs and security requirements.
 
I can only say so much... but I'm simply amazed, to say the least. Click here for more information 
or experience it for yourself, a white paper is also available for you below.
 
Download ICPD Whitepaper
 
Line

Expand your Business Value with intelligence and Analytics

Mode_Comment_Icon_black0
Alarm_Icon_13 min

business-intelligence-and-analytics-2

Forward-thinking enterprises are using business intelligence and analytics to navigate through their digital transformation – one that could see them expand both physically and fiscally at a rapid pace.

The ability to harness this data and use it to make business decisions, however, poses challenges. This is particularly true for organisations that haven’t previously had the technology nor the manpower to sift through all the historical data they’ve accumulated in their daily activities.

Think about it – by 2020 it’s predicted there will be 5,200GB of data for every individual on the planet. More importantly, 90% of our current data is ‘unstructured’, drawn from mediums like social media and Internet of Things (IoT) devices.


Harnessing the power of business intelligence and analytics

So how can enterprises take advantage of data analytics? It starts with the three ‘I’s:

  • Investment: Collecting and analysing your company data for future activities. You might be surprised what sort of data can be used for predictive modelling purposes to forecast future trends and outcomes.
  • Innovation: Harnessing unexplored or raw data to see if your business can create new products or services.
  • Improvisation: Parsing business data to find new meaning in it. This can lead to actionable insights that feed into the analytics cycle.


business-intelligence-and-analytics-group-2


Using data to generate value

More and more businesses are recognising the usefulness of their data, but there’s still a way to go. While more than 80% see AI as a strategic opportunity, most aren’t using data to its full advantage.

These organisations may be using AI to reduce their operational costs or modernise their systems for better business intelligence and data warehousing, but to derive the very best value from your data, you need to be an insights-driven and transformative company.


What is the analytics cycle?

This all feeds into the analytics cycle, of which there is no one-size-fits-all design. IBM, for example, defines the cycle as taking a Planning, Descriptive, Diagnostic, Predictive and Prescriptive approach.

But the bottom line is that every business’s analytics cycle should feed into one central goal: gaining a competitive advantage.

Your cycle might start with identifying a business problem, preparing and analysing the data, A/B testing different solutions and then monitoring the results.

And that model will likely change according to the data you are analysing or the business problem you need to solve. So long as the target is building a more sustainable and competitive business, you’ll be able to use your business intelligence and analytics to generate greater value for your company.

Are you looking to harness the power of data and rise above the competition? Contact Octane Software Solutions today to find out how we can help you derive real business value from your data.


business-intelligence-and-analytics-octane


Got a question? Shoot!

Lorem ipsum dolor sit amet, consectetur adipiscing elit, sed do eiusmod tempor incididunt ut labore et dolore magna aliqua.

Get more articles like this delivered to your inbox